
 Home
Home News
News
- XRP continues its downwards trend after failure battle between buyers and sellers
- XRP has a massive dropdown in volume that is 20% down at $1.7 billion in the last 24-hours.
- XRP/BTC pair trading negative by 0.19% at 0.00001773 BTC.
Since August, XRP has climbed to $1.35 on 3rd September. The most recent attempt to reach these levels was in early November, but XRP was met with another hard rejection and has moved lower since then.

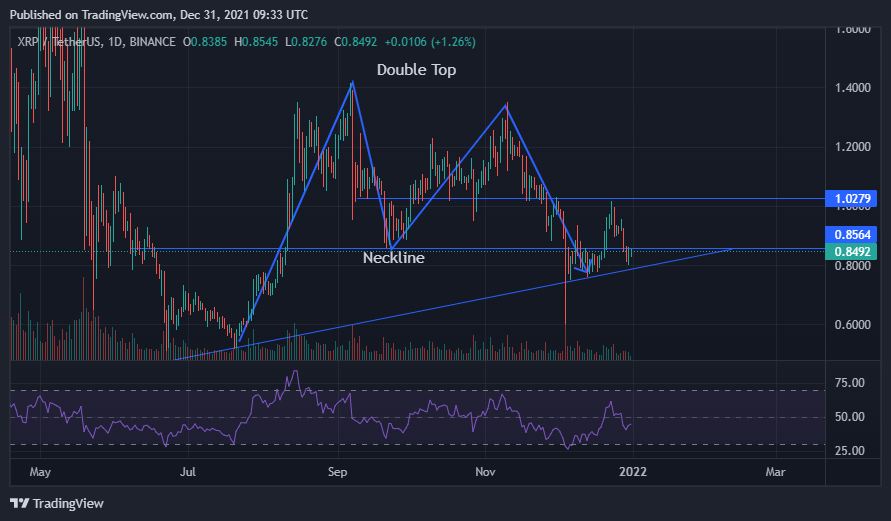
XRP today’s price is down a bit by 0.24% at $ 0.8338. XRP has lost 20.5% volume in the last 24-hours trading session. This market scenario clearly shows that Coin is struggling in the battle of buyers and sellers. Coin price has been taking support for short-term level, at $0.78 key price and may visit these low once again. We all know BTC has dominance in the crypto market and can further impact XRP’s price.

The Coin was making a Double Top pattern in the daily time frame; as soon as it broke its double top formation neckline (which was considered a support level ), it went down and found support upon the upwards trendline. A bit of buying pressure came, but buyers failed to hold it.
Relative strength index (RSI) indicated soft buying pressure after testing its support level of 30. After taking support, it started to move to bullish price action, but sellers started selling after finding resistance at USD 1.02.
XRP coin trading in a crucial level
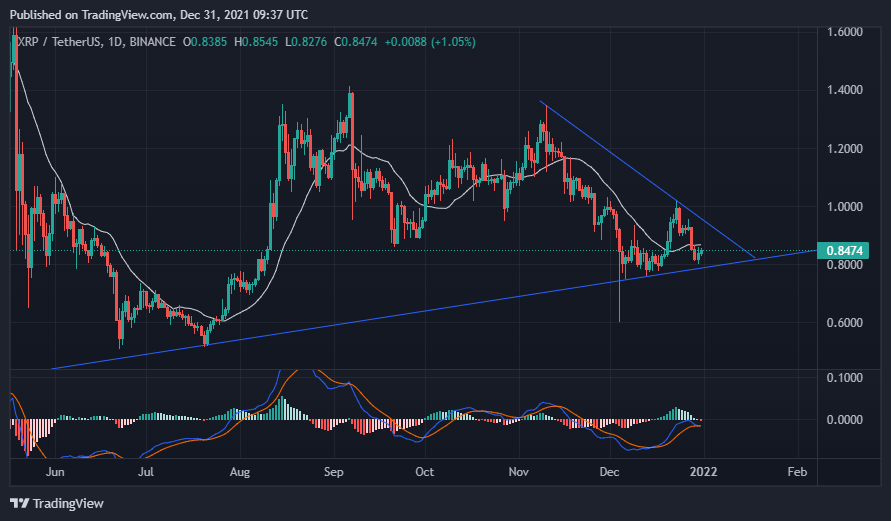
The price action of Ripple coin indicates the triangular pattern after 10 November trending sessions, and it has been moving in this range for a long. But it may break this triangular pattern in further trending sessions. It depends on further price action where it goes. $0.78 and $0.71 are crucial levels of support for XRP buyers to preserve. A close below these levels will probably see XRP head toward $0.63
XRP is testing 20 Moving Average (MA). it is likely to keep it as a resistance for a short-term period. sellers will more actively keep selling below this moving average line
From 4th December onwards, Moving Average Convergence Divergence (MACD) indicates buying after bullish crossover, but because of triangular price action, MACD behaves the consolidation.
Conclusion
XRP is now in a consolidation phase because it is trending in a triangular chart pattern. The $0.78- $0.82 is a crucial zone where XRP could swing again and dip into the $0.75 zone after breaching the upwards trendline, and the next support level will be $0.50.
Support level – $0.60
Resistance level – $1.35
Disclaimer
The views and opinions stated by the author, or any people named in this article, are for informational ideas only, and they do not establish the financial, investment, or other advice. Investing in or trading crypto assets comes with a risk of financial loss.
Steve Anderson is an Australian crypto enthusiast. He is a specialist in management and trading for over 5 years. Steve has worked as a crypto trader, he loves learning about decentralisation, understanding the true potential of the blockchain.


