
 Home
Home News
News

- Chainlink price has been rising through an ascending parallel channel over the daily price chart.
- LINK crypto has recovered above 20, 50, and 100-days DMA and is now preparing for 200-days DMA.
- The pair of LINK/BTC is at 0.0003979 BTC with an intraday gain of 0.64%.
Chainlink’s price is attempting to ascend via an upward channel over the daily price chart. The coin is currently advancing as it approaches the upper trendline of the channel. The LINK currency needs to keep up its current speed in order to recover and overcome a critical resistance level. LINK bulls must maintain the upward momentum for the token to be able to break free of the ascending parallel channel with a strong bullish surge. However, bears are attempting to short the LINK market. It is challenging for cryptocurrencies like LINK to recover successfully in a sluggish market. Investors in LINK must wait until bulls retain their position at the upper trendline of the ascending parallel channel.

The estimated current price of Chainlink is $7.94, and on the previous day, it increased by 1.20% of its market value. However, during the intraday trading session, trade volume fell by 22.50%. In an effort to short the LINK cryptocurrency market, bears are at it. The volume to market cap ratio is 0.1138.

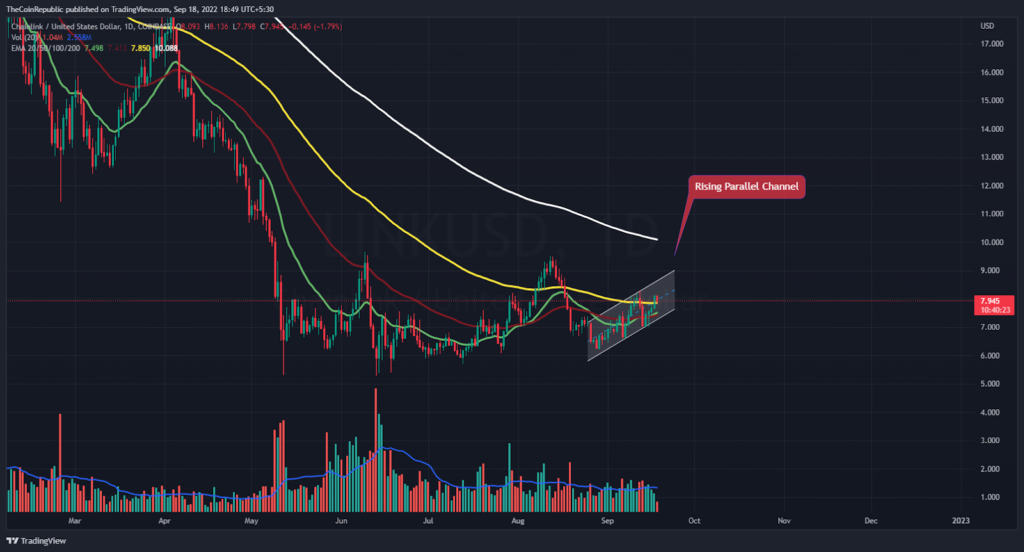
More purchases are required for the price of the LINK coin to move closer to the top trendline of the channel. Volume change, however, suggests that the accumulation of bulls is insufficient and needs to be improved for LINK to soar. The LINK coin price must increase toward the upper trendline for its recovery phase to be noticeable on the daily price chart.
What do Technical Indicators suggest about LINK?
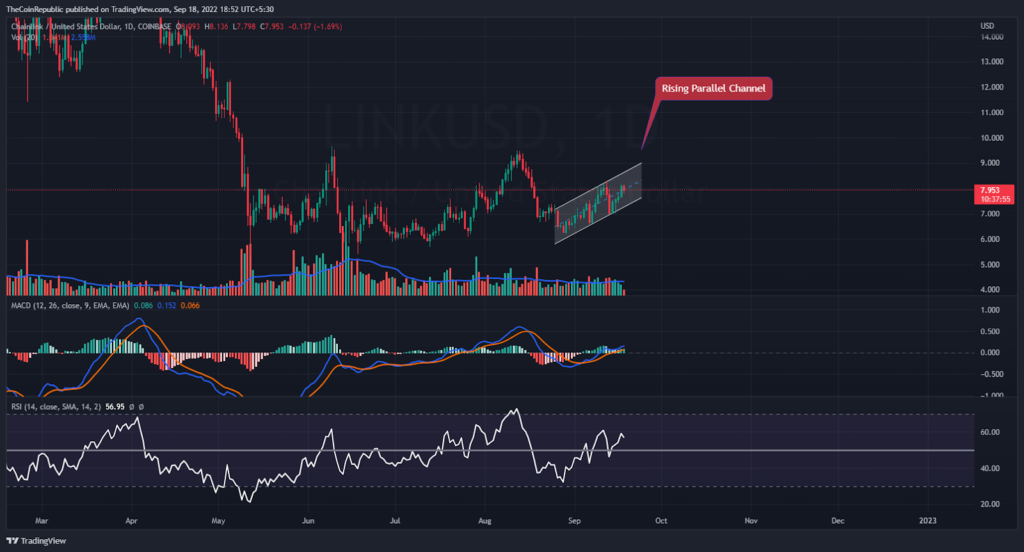
The daily price chart of the LINK cryptocurrency shows a rising parallel channel as a hint of recovery. Technical indicators show that the decrease in LINK cryptocurrency is strong.
The strength of the drop in the LINK cryptocurrency is shown by the relative strength index. The RSI is 57 and is going in a neutral direction. On MACD, the drop momentum of the LINK coin is discernible. The MACD line is ahead of the signal line and is headed in the direction of a negative crossing. Investors in LINK must keep an eye on the daily chart for any changes in trend.
Conclusion
Chainlink’s price is attempting to ascend via an upward channel over the daily price chart. The coin is currently advancing as it approaches the upper trendline of the channel. The LINK currency needs to keep up its current speed in order to recover and overcome a critical resistance level. LINK bulls must maintain the upward momentum for the token to be able to break free of the ascending parallel channel with a strong bullish surge. The LINK coin price must increase toward the upper trendline for its recovery phase to be noticeable on the daily price chart. Technical indicators show that the decrease in LINK cryptocurrency is strong.
Technical Levels
Support Levels: $7.65 and $6.65
Resistance Levels: $8.00 and $8.30
Disclaimer
The views and opinions stated by the author, or any people named in this article, are for informational ideas only, and they do not establish any financial, investment, or other advice. Investing in or trading crypto assets comes with a risk of financial loss.
Steve Anderson is an Australian crypto enthusiast. He is a specialist in management and trading for over 5 years. Steve has worked as a crypto trader, he loves learning about decentralisation, understanding the true potential of the blockchain.


