
 Home
Home News
News
- 1 Ethereum Classic price (ETC) slid 0.04% in the last 24 hours and is currently trading at $18.05.
- 2 Ethereum Classic (ETC) derivatives data states that a total of $140.19K open contracts have been created over the past 24 hours.
Ethereum Classic (ETC) is a smart contract network split from Ethereum (ETH) in July 2016. It hosts and supports decentralized applications (DApps). Ethereum Classic wanted to keep the original Ethereum blockchain after a hack stole 3.6 million ETH. Ethereum Classic and Ethereum have different technical goals and paths.
The Ethereum Classic price is currently trading at $18.05, with a decline of 0.04% in the past 24 hours. Ethereum Classic holds a total market cap of $2.56 Billion and ranks 29th in the crypto market.
ETC token has a trading volume of $99.19 Million, with a decline of 27.18% over the past 24 hours. It has over 142.17 Million tokens in circulating supply. The volume-to-market cap ratio of the Ethereum Classic coin is 3.86% indicating low volatility in the market.
Ethereum Classic Price Prediction Using Price Action Strategy
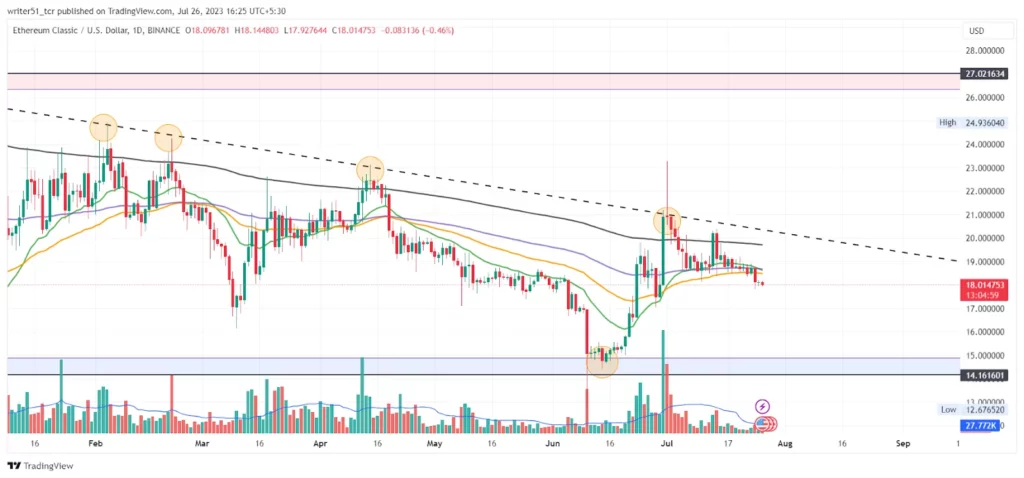
Ethereum Classic price analysis reveals that the ETC token surged nearly 180% in July 2022, breaking above the previous swing high. After that, the price declined and went into a correction phase, forming a descending triangle pattern with resistance from an upper trendline and support from a horizontal demand zone.
Recently, the price bounced back from the demand zone with a rise in volume but could not break above the trendline resistance and got detained. Currently, the price is consolidating near the trendline resistance.
Now, If the price can sustain above the trendline resistance, it may result in a trend change from the correction phase to an advancement phase. This may attract buyers and push the price higher.
ETC Price Forecast from Indicators’ point of view
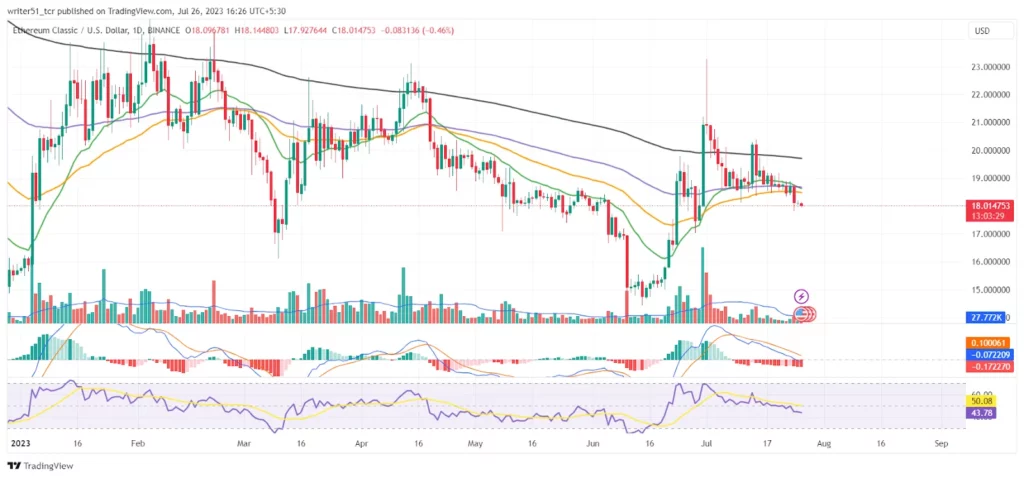
As per the EMA analysis, the ETC price suffered rejection from the 200 EMA. Currently, the price tried to sustain above 50 EMA but suffered rejection indicating bearish sentiment prevailing in the short term.
At the time of publishing, the RSI value of the ETC token is 44.18, and that of the SMA line is 50.11. RSI has gone flat, showing a neutral bias in the market for now.
MACD lines have made a bearish crossover. Also, Histogram bars are being formed below the mean line with increasing height, indicating a negative sentiment being built in the market for now.
Conclusion
Ethereum Classic price prediction shows that the price has undergone a correction phase after a surge of nearly 180% in July 2022 and formed a descending triangle pattern. Recently, the price hiked nearly 40% after getting support from the demand zone. But could not break above the trendline resistance and is consolidated. Now, if the price can break and sustain above the trendline resistance, then it may surge higher.
Technical Levels
- Support levels: $14.1 and $10.3.
- Resistance levels: $26.9 and $34.7.
Disclaimer
The views and opinions stated by the author, or any people named in this article, are for informational purposes only and do not establish financial, investment, or other advice. Investing in or trading crypto or stock comes with a risk of financial loss.

With a background in journalism, Ritika Sharma has worked with many reputed media firms focusing on general news such as politics and crime. She joined The Coin Republic as a reporter for crypto, and found a great passion for cryptocurrency, Web3, NFTs and other digital assets. She spends a lot of time researching and delving deeper into these concepts around the clock, and is a strong advocate for women in STEM.


