
 Home
Home News
News

- ETH is currently trading at $1188 with an intraday gain of 1%.
- The bulls are draining the strength by giving up the intraday gains.
ETH price is in phobia from the last month, trading inside the rectangular cage. The prices hopefully jump from the middle Bollinger band and do not sustain over the top, resulting in a downfall. These ups and downs lay the volume lowering by 60% in the last 24 hrs. ETH is now trading below the significant moving averages showing a weak layout.

The price dropped by 17% in the last three sessions and held the $1100 mark. The bears are now in momentum and preserving their positions on the top, indicating the bulls’ weakness. The price action now suggests that sharp selling and shorts build-up happened after hitting the top of $1675 in the previous months. The momentum deviated towards the bears, and the price fell on a streak.

Daily Chart Showing gradual declination of price.
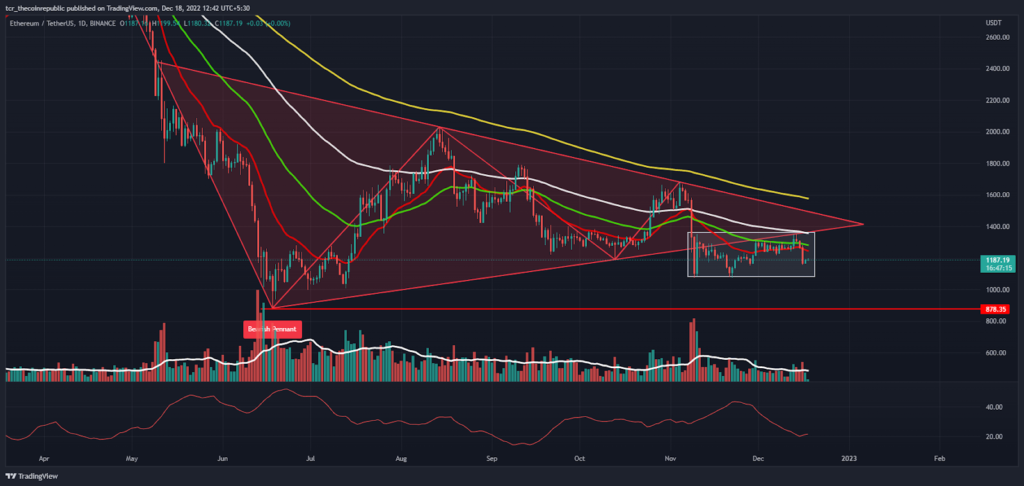
On a daily time frame, ETH was forming a bearish pennant chart pattern which was broken earlier in the prior sessions. The price trades below the lower trendline and the 20 DMA signifies the bearish trend.
The ADX also justifies hawkish alerts as it was near 20. The price is heading towards the lower trajectory at $1080, which is the immediate support and strong support at the round level of $1000. Moreover, if a pullback happens, the near-term hurdle is at $1400, where bears place their positions tightly.
Short-Term Chart Shows In-the-Box Activity
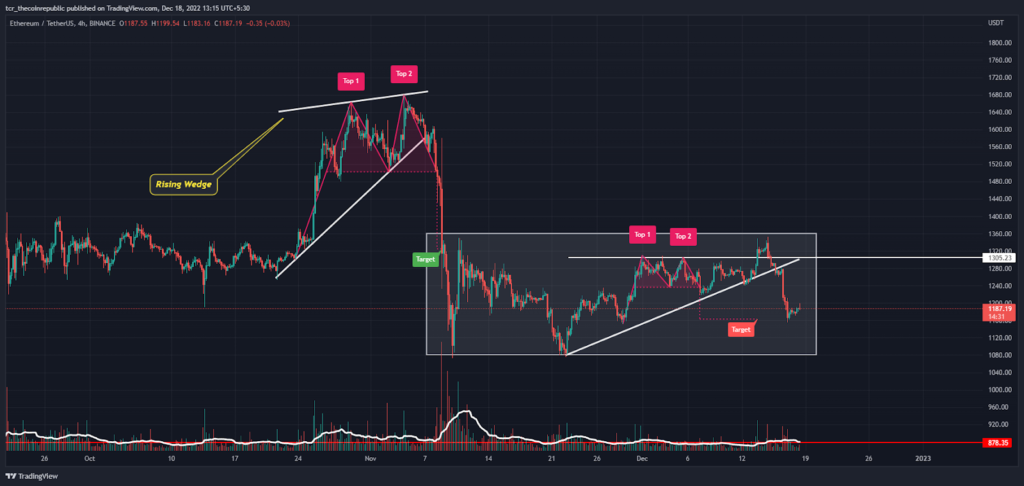
On the 4-hour chart, the recent double top formation leads the price fall from the resistance mark of $1300 and the price showcases the fall as per the chart guides.
The recent breakdown of the lower trendline with the addition of the shorts build-up ensures the weakening trend. The validation came when the price rasped below the low of the double top at the $1250 mark, which assures the decline.
What RSI and MACD guides ?
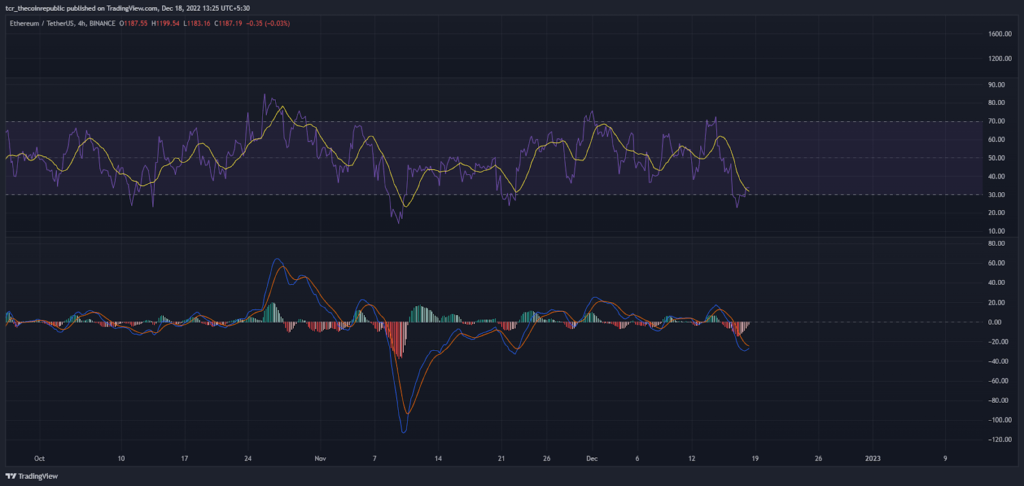
RSI ( Strong Sell): The RSI is now at 30, suggesting that it is now in the oversold range where a retracement awaits in the near-term sessions. The signal line is just with the collapse of the MA line implies hope for the holders for the upcoming sessions.
MACD ( Bearish ): The MACD also indicates that in the previous sessions, the bearish crossover marked, as similar to the RSI, the signal line now merges the MA line waiting for the crossover.
Conclusion:
Ethereum price is now heading to retest the near-term support of $1100 once for the further bounce. The coin in the previous months tested the upper range multiple times but faced rejection every time. This claims that on the mark of $1300, strong positioning of bears is there, which bulls cannot break.
Support Levels:$1000 and $880
Resistance Levels: $1400 and $1650
Disclaimer
The views and opinions stated by the author, or any people named in this article, are for informational ideas only, and they do not establish financial, investment, or other advice. Investing in or trading crypto assets comes with a risk of financial loss.

With a background in journalism, Ritika Sharma has worked with many reputed media firms focusing on general news such as politics and crime. She joined The Coin Republic as a reporter for crypto, and found a great passion for cryptocurrency, Web3, NFTs and other digital assets. She spends a lot of time researching and delving deeper into these concepts around the clock, and is a strong advocate for women in STEM.


