
 Home
Home News
News

- Litecoin price prediction showcases the rise of LTC crypto through an interesting channel over the daily time frame chart.
- LTC crypto is trading above 20, 50, 100 and 200-days Daily Moving Average.
- The pair of LTC/BTC was at 0.004308 BTC with an intraday drop of 0.56%.
The token’s maximum recovery is predicted by Litecoin price prediction 2023 to be $150 in 2023. On the daily time frame chart, LTC cryptocurrency went through some unusual patterns. The price of Litecoin initially began to decline into a descending wedge and then briefly stabilized on the daily time chart. After that, LTC cryptocurrency began to recover and joined a rising parallel channel. It is currently attempting to sustain itself inside the channel to continue its recovery. When LTC maintains its price over $100 in 2023, analysts from a major crypto firm predict that it will rise to a level of $150.

The price of Litecoin was $98.47, and throughout the day’s trade, it lost 2.30% of its market capitalization. The intraday trading session has seen a 1.28% reduction in trade volume. This suggests that sellers are currently attempting to push LTC towards the ascending parallel channel’s lower trendline. Market capitalization to volume stood at 0.0911.

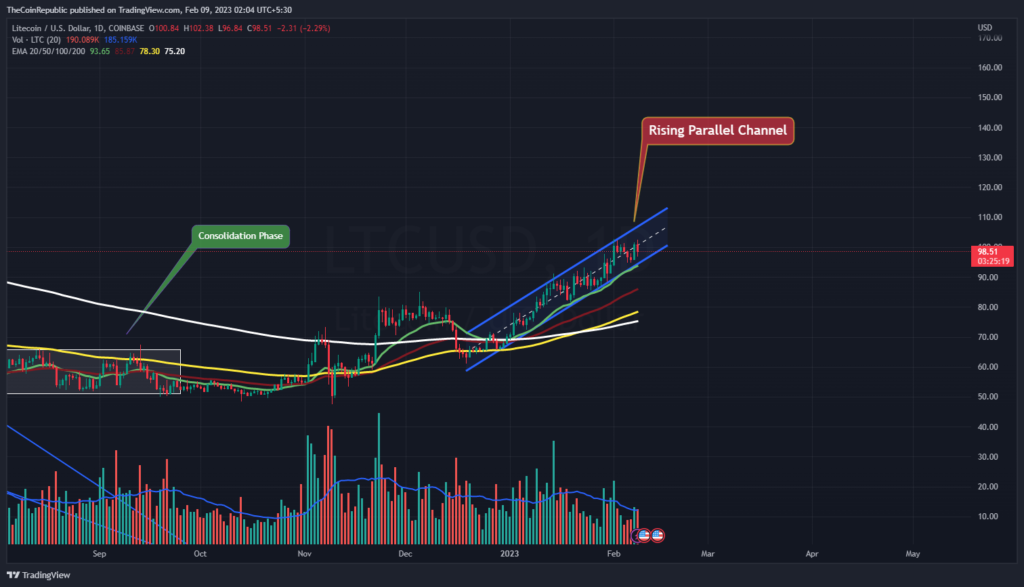
According to the daily time frame chart, the LTC token price may rebound with significant rising momentum in 2023, according to the Litecoin Price prediction. The recovery of LTC crypto must be maintained inside the parallel channel. However, volume change appears to be below average and must increase for LTC to rebound. The price of LTC has risen above the 20, 50, 100, and 200-day Daily Moving Averages. The value of LTC has been ranging between $96.24 and $98.88 recently.
Will Litecoin Price Maintain its Recovery Phase?
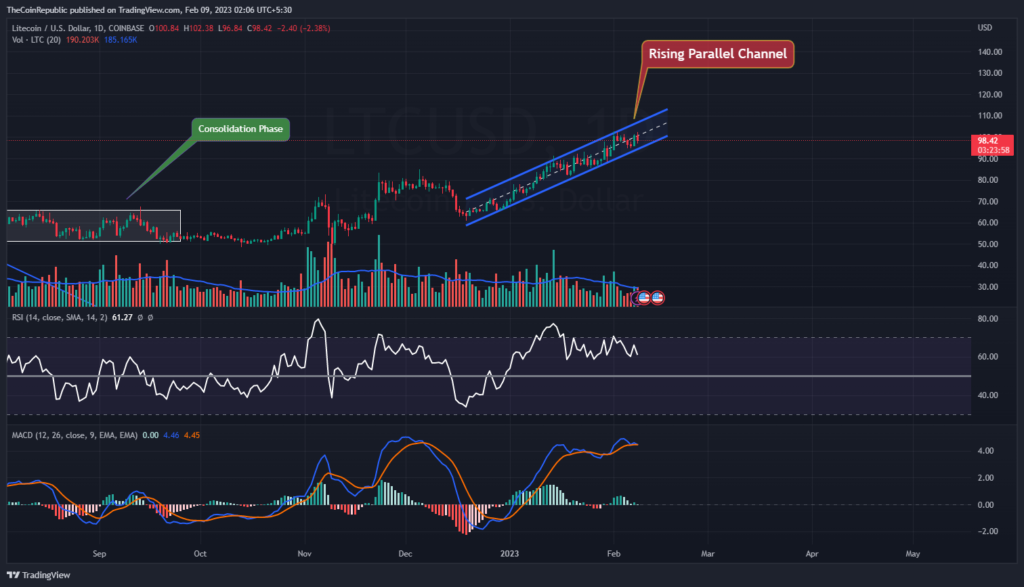
The daily time frame chart of the token’s recovery is displayed by the Litecoin price prediction. Technical indications point to the momentum of the token’s downward trend within the parallel channel.
The momentum of LTC’s fall within the channel is displayed by the relative strength index. When it was at 61, the RSI was moving towards neutrality. The LTC coin’s decline momentum is visible on MACD. The MACD line is about to have a negative crossover with the signal line. Investors in the LTC cryptocurrency should watch the daily time frame chart for any directional changes.
Summary
The token’s maximum recovery is predicted by Litecoin price prediction 2023 to be $150 in 2023. On the daily time frame chart, LTC cryptocurrency went through some unusual patterns. The recovery of LTC crypto must be maintained inside the parallel channel. However, volume change appears to be below average and must increase for LTC to rebound. Technical indications point to the momentum of the token’s downward trend within the parallel channel. The MACD line is about to have a negative crossover with the signal line. Investors in the LTC cryptocurrency should watch the daily time frame chart for any directional changes.
Technical Levels
Support Levels: $95.00 and $90.00
Resistance Levels: $100.00 and $107.00
Disclaimer
The views and opinions stated by the author, or any people named in this article, are for informational ideas only, and they do not establish financial, investment, or other advice. Investing in or trading crypto assets comes with a risk of financial loss.

Andrew is a blockchain developer who developed his interest in cryptocurrencies while pursuing his post-graduation major in blockchain development. He is a keen observer of details and shares his passion for writing, along with coding. His backend knowledge about blockchain helps him give a unique perspective to his writing skills, and a reliable craft at explaining the concepts such as blockchain programming, languages and token minting. He also frequently shares technical details and performance indicators of ICOs and IDOs.


