
 Home
Home News
News

- XOM stock price has fallen back to the demand zone after facing a strong bearish pressure at the resistance.
- XOM stock price has although managed to sustain at the demand zone, but it remains to see if the price will bounce off successfully.
- XOM stock price has reiterated to the supply zone it broke for a retest on a daily time frame.
XOM stock price has managed to sustain at the demand zone despite the sharp bearish spell in the market. This comes following the collapse of multiple crypto friendly and start-up friendly banks. At present, XOM stock price is trading at $101.03.
Exxon Mobil Corporation is an American multinational oil and gas corporation that specialises in the exploration, production, refining, and marketing of petroleum products. It is one of the largest publicly traded companies in the world, with its operations in over 50 countries.

XOM Stock Price Illustrates a Possible Reversal
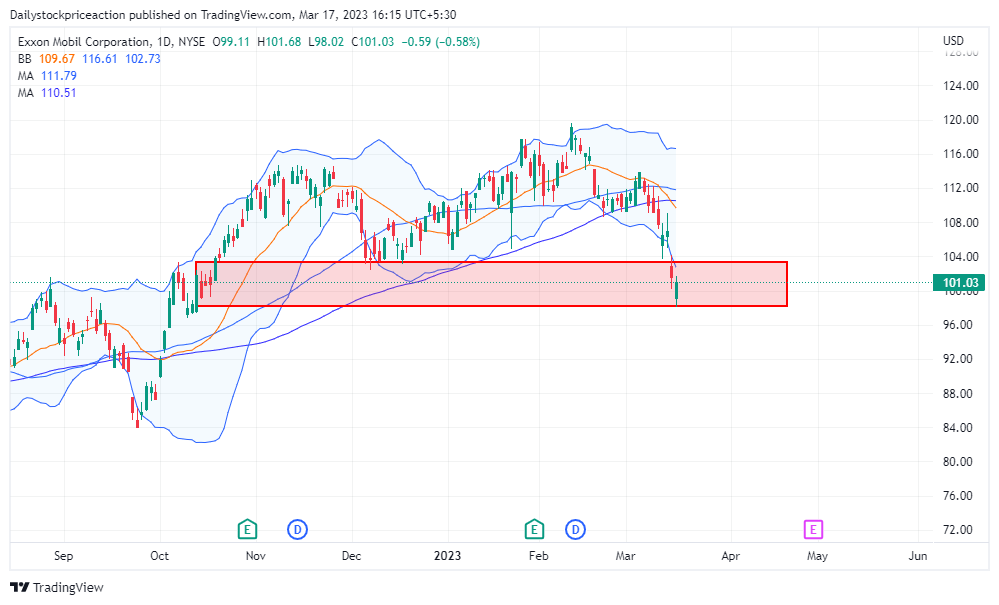
XOM stock price fell back to the long term demand zone after showing strong consolidation. XOM stock price was seen opening gap down after a strong opening blow of the strong fall of the index. XOM stock price is trading below the 50- and 100-day Moving Averages. However, it bottomed out and when moving upwards, these MAs can be seen acting as a strong supply zone.
XOM token price is trading at the lower band of the bollinger band indicator. This comes after the stock price fell below the important demand zone. However, the stock price formed a bullish candlestick pattern at the bottom indicating the presence of the bulls. Volumes have increased authenticating the presence of the bulls. It remains to be seen if the stock price will bounce off successfully or fall below the demand zone.
XOM Token Price Rests at the Support Zone
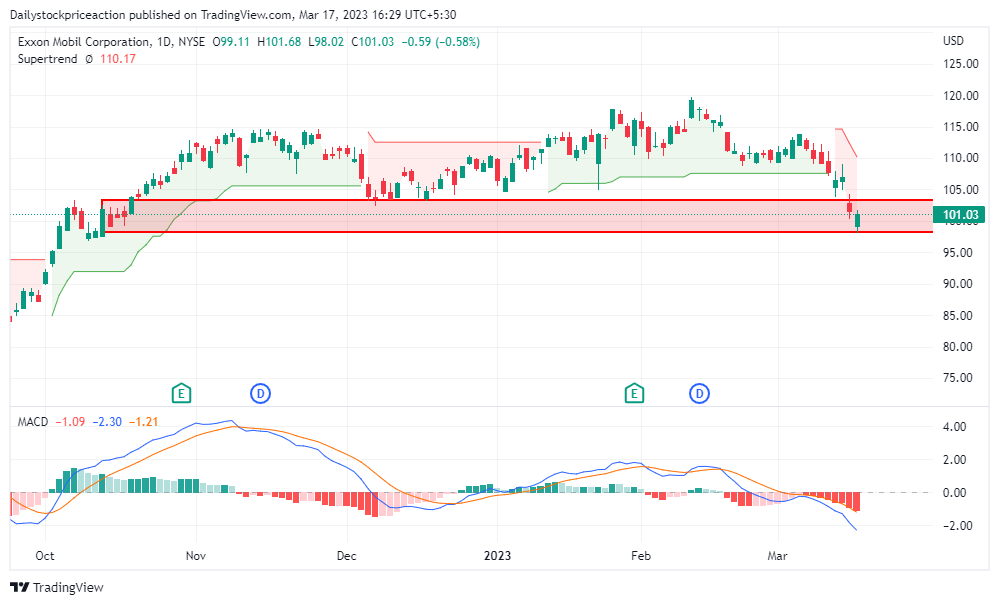
MACD indicator triggered a negative crossover as soon as the stock price fell below the short term demand ozone. The blue line crossed the orange line on the downside. XOM stock price faced strong bearish pressure and since then it has been on a downtrend. For the stock price to start a bullish trend, it has to sustain the bearish pressure.
Supertrend indicator triggered a strong bearish signal. As soon as the XOM stock price fell below the $107.44 level, the indicator triggered a sell signal. Prior to that, XOM stock price was taking support of the supertrend buy line. Moving forward, the supertrend sell line could act as a strong supply zone and thus a strong bullish pressure would be required to break the resistance and move upwards.
Support: $98 and 96
Resistance: $109 and $107
Disclaimer
The views and opinions stated by the author, or any people named in this article, are for informational purposes only, and they do not establish financial, investment, or other advice. Investing in or trading crypto assets comes with a risk of financial loss

Nancy J. Allen is a crypto enthusiast, with a major in macroeconomics and minor in business statistics. She believes that cryptocurrencies inspire people to be their own banks, and step aside from traditional monetary exchange systems. She is also intrigued by blockchain technology and its functioning. She frequently researches, and posts content on the top altcoins, their theoretical working principles and technical price predictions.


