
 Home
Home News
News
- 1 TRX/USDT is currently trading at $0.07048 while seeing a change in 24 hours of -24%.
- 2 The price depreciated by 9.50% within 7 days.
Observing the present price action the TRON token is forecasting a substantial decline of its value within the near future. The price is at present trading below crucial 200 EMA and MA resistance levels on the daily around an important support level near the trendline which has been respected by the buyers for the past 9 months on the daily time frame.
The price of TRON recently saw an abrupt bearish decline of 16% after breaking the 20 EMA level. Though the red candle suggests that rapid buying activity took place once the price reached its support zone near the trendline supported by 200 EMA. Presently, the bears are suggesting that they are not prepared to relinquish the control back to bulls.
The current value of the TRON token is $0.07048. At press time, the market cap was $6.34 Billion.
Technical Analysis (1-Day Timeframe )

The RSI line is momentarily facing severe resistance from the median line and 14 SMA. The value of 14 SMA is 51.58 points and the RSI line is near 41.59 points taking rejection from the 14 SMA.
At present, the stochastic RSI is trading near extreme undersold levels. It is about to make a bullish reversal in a daily time frame. The %K is steadily approaching the 20 RSI level with the %D line. The value of stochastic RSI is 14.17 points.
A Decline In Market Sentiment
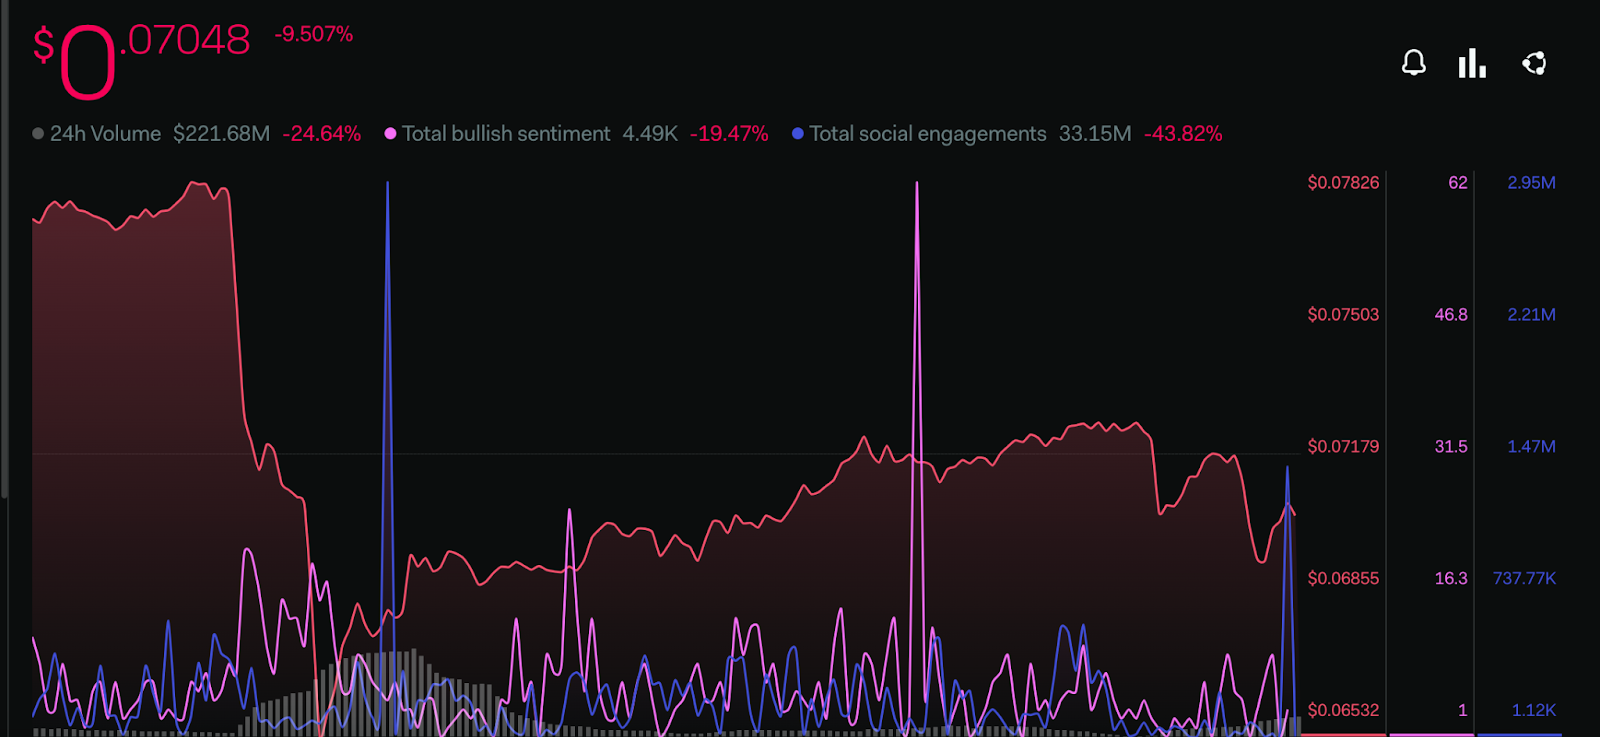
Buoyant sentiments of the investors are taking a pessimistic turn at present as per LunarCrush. The total bullish sentiment metric has declined by 19.47% within the last 7 days. A negative fall is also being observed in total social engagement volume which is an ominous indication regarding the social media metrics of the token.
A Sudden Rise in Active Users and TVL of TRX Token
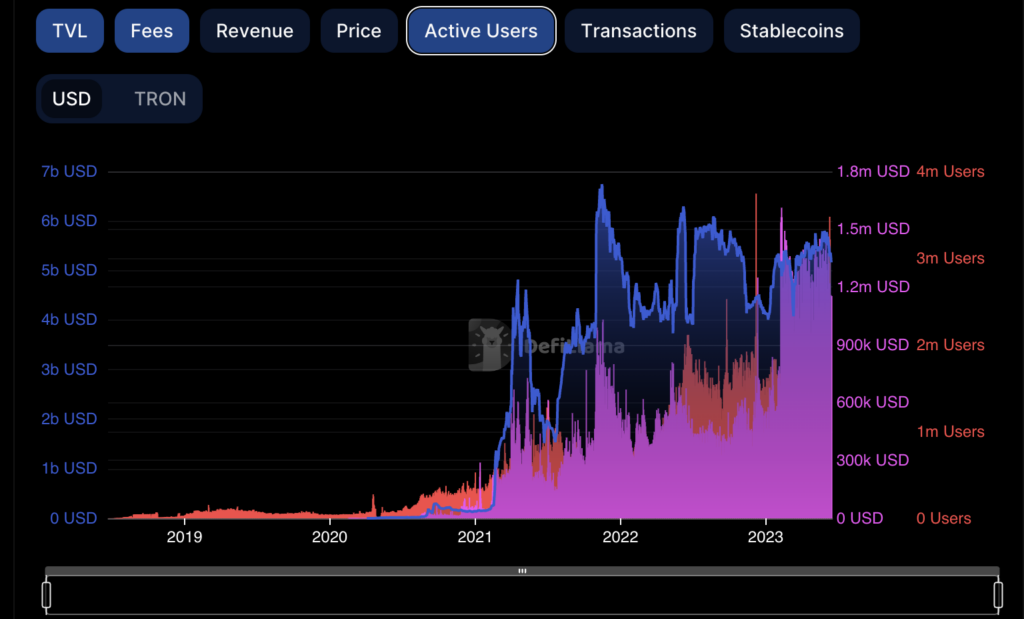
A sharp surge has been observed in the Active Users, TVL, and within the past few weeks according to the DefiLama platform. The value is moving near an all-time high. The TVL of Tron is $5.71 Billion. Number of active users has surged. The number of active users is more than 3 Million whereas the fees generated by the platform is around 1.5 Million.
Conclusion
The majority of the technical indicators are currently giving bullish signs. It is near its current demand zone, under bullish positiveness for the past few weeks the price action and technical indicators and prior price action imply that the price may make another endeavor to make a rebound.
Technical levels –
Support– $0.08500
Resistance- $0.9000
Disclaimer
The views and opinions stated by the author, or any people named in this article, are for informational purposes only, and they do not establish financial, investment, or other advice. Investing in or trading crypto assets comes with a risk of financial loss.

Andrew is a blockchain developer who developed his interest in cryptocurrencies while pursuing his post-graduation major in blockchain development. He is a keen observer of details and shares his passion for writing, along with coding. His backend knowledge about blockchain helps him give a unique perspective to his writing skills, and a reliable craft at explaining the concepts such as blockchain programming, languages and token minting. He also frequently shares technical details and performance indicators of ICOs and IDOs.


