
 Home
Home News
News
- 1 MINA’s price prediction is currently at $0.2748, and is down by 10.10% in the last 24 hours.
- 2 MINA recorded a 6.66% increase in 24-hour trading volume.
- 3 The price makes an evening star and double top pattern.
MINA price prediction is suggesting bears and bulls are yet to gain a proper grasp on the trend. Investors might prefer to wait for a confluence of multiple technical indicators in order to decide the direction of the trend. There is a slight increase in the green candles of volume which suggests the MINA price is attracting buyers at the demand zone.
Investor sentiments regarding the MINA price are indecisive at present and may remain negative unless the buyers start stepping into the price action with substantial momentum. However, according to the technical indicators and price action, the odds are lining in the bull’s favor.

The present value of MINA is $0.440, and it has a market capitalization of around $410.17 Million.
MINA Price Prediction: Technical Analysis on 1 Week Timeframe
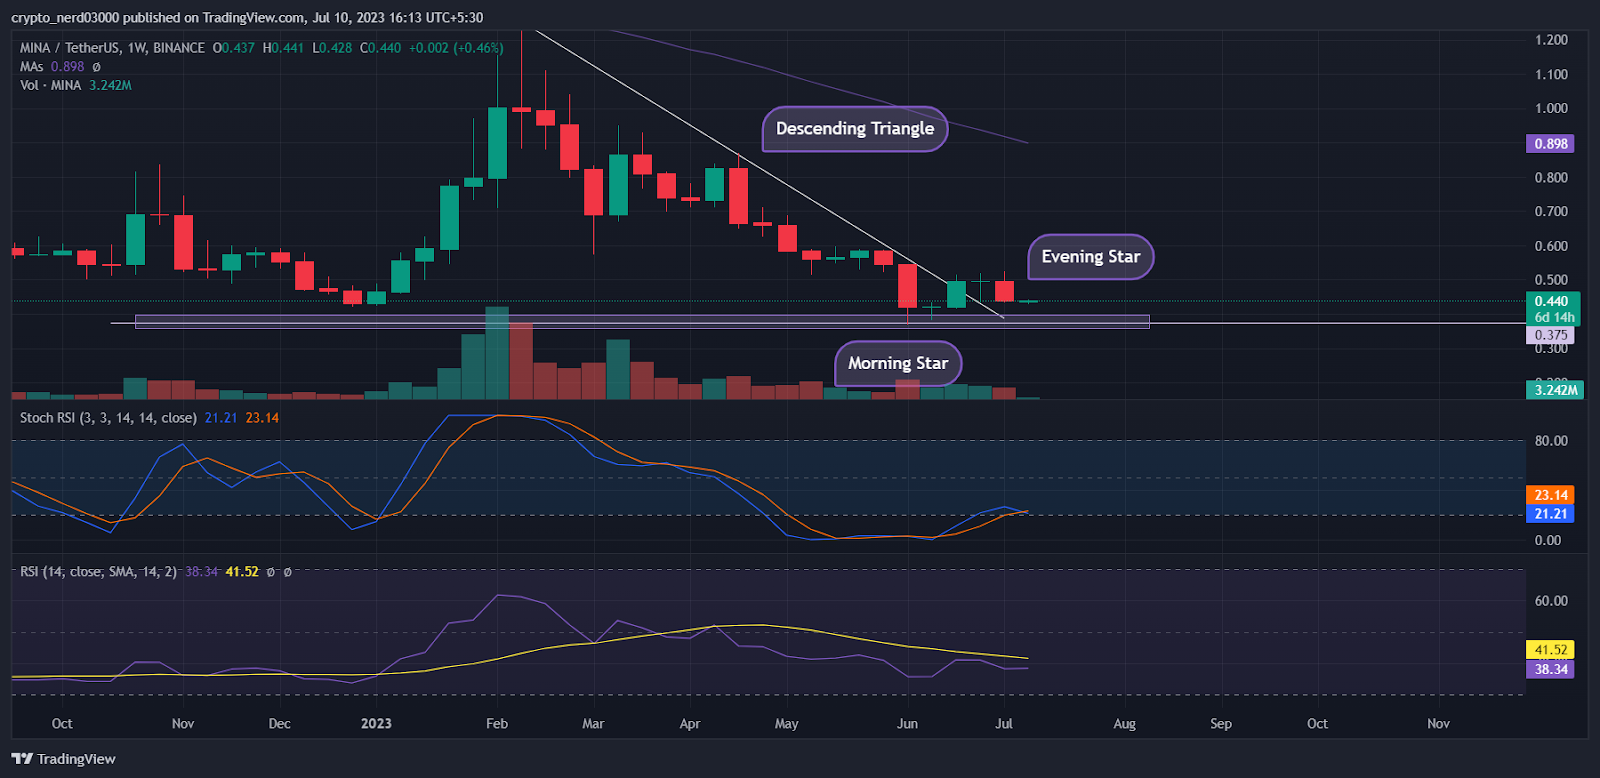
The price patterns made through candlesticks present a controversial view. The MINA price is making an evening star a bearish pattern after making a morning star a bullish pattern on the weekly chart. Both of the patterns are not fully developed which may cause some hesitancy on the buyer’s part.
Investors may prefer to take multiple technical indicators into perspective in order to gain an edge. Presently, a bullish candle is developing where the price recently broke the descending triangle, but is yet to gain momentum.
MINA Price Prediction: Technical Analysis on 1 Day Timeframe
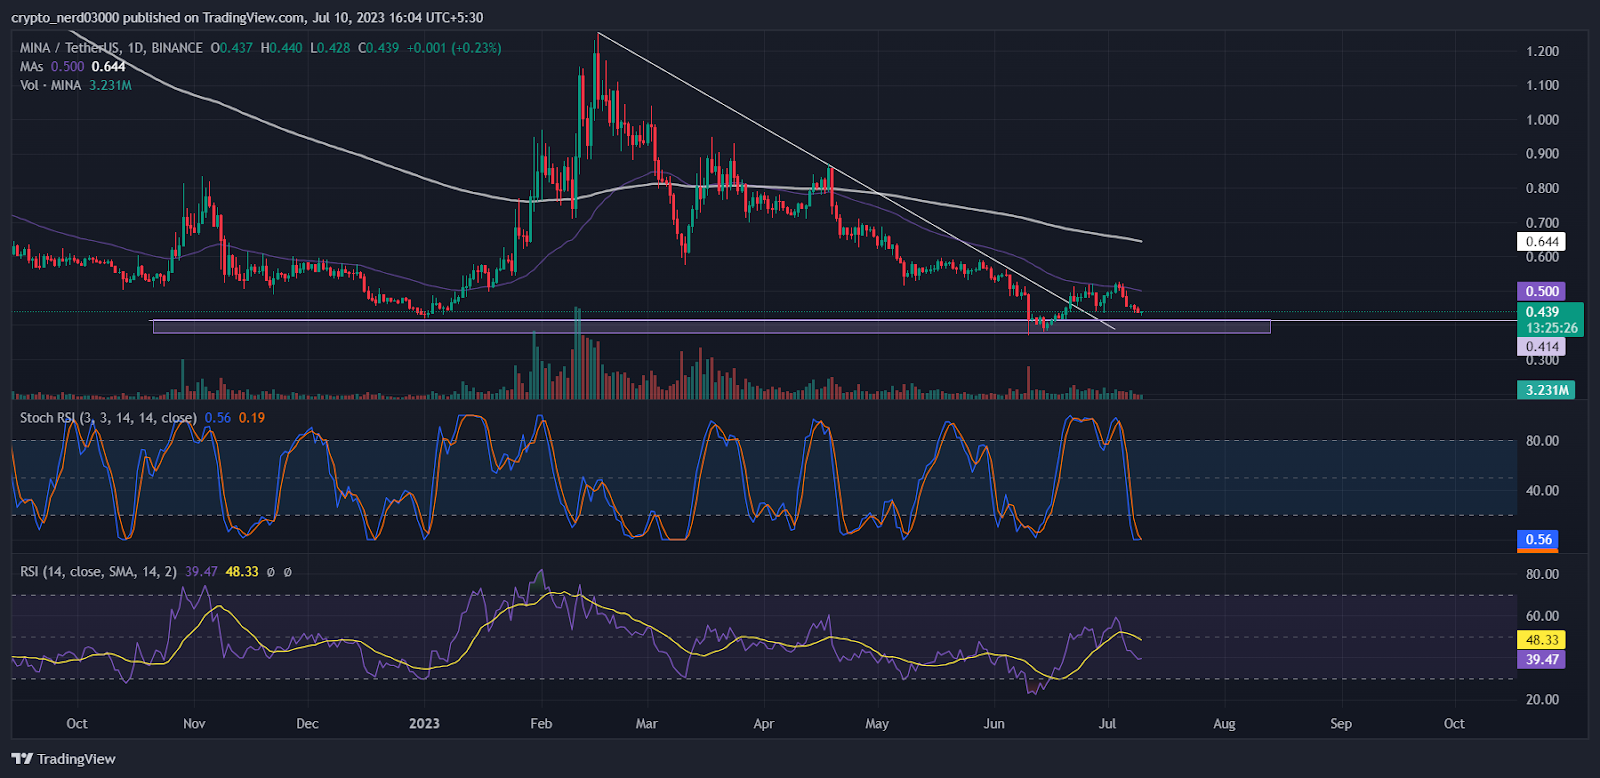
MINA price is moving near the demand zone around $0.400 after making a retest from the descending triangle. Presently, it is gaining severe pressure from the 50 EMA line.
The RSI oscillator is approaching the demand zone. A slight upward curve suggests it can take a retest from 14 SMA before taking a further decline. The current value of RSI is 39.47 points, whereas the 14 SMA is providing resistance to it at 48.33 points.
The stochastic RSI is moving near the demand zone after making a double top. The current value of Stochastic RSI is 0.56 points. Observing the previous movements, the investors may look out for a proper reversal to take the confirmation for a rally.
Conclusion
As per the analysis, technical indicators, and price action, the odds are lining in the bulls’ favor.The oscillators are approaching the demand levels on one day chart. In the longer timeframe, the technical indicators reflect the same possibility for MINA price. The evening star pattern is not fully developed which may cause some hesitancy on the investors part
Technical levels –
Support – $0.200
Resistance – $0.300
Disclaimer
The views and opinions stated by the author, or any people named in this article, are for informational purposes only, and they do not establish financial, investment, or other advice. Investing in or trading crypto assets comes with a risk of financial loss.

Nancy J. Allen is a crypto enthusiast, with a major in macroeconomics and minor in business statistics. She believes that cryptocurrencies inspire people to be their own banks, and step aside from traditional monetary exchange systems. She is also intrigued by blockchain technology and its functioning. She frequently researches, and posts content on the top altcoins, their theoretical working principles and technical price predictions.


