
 Home
Home News
News
- 1 The Uber Technologies, Inc. (UBER) stock price is trading at $46.61 currently with a market capitalization of $94.331 Billion.
- 2 UBER stock gave a total return of 56.94% in a span of 6 months.
Uber Technologies, Inc. (NYSE: UBER) will host its quarterly earnings call to review its Q2 2023 financial performance on Tuesday, August 1st at 5:00 a.m. PT (8:00 a.m. ET).
Early Estimates For Q2
Uber expects its Gross Bookings to range from $33.0 Billion to $34.0 Billion, which would reflect steady growth in both Mobility and Delivery segments. Uber also expects its Adjusted EBITDA to range from $800 Million to $850 Million, indicating improved profitability and efficiency.
What happened in Q1?
Uber Technologies, Inc. reported its financial results for the first quarter of 2023, showing strong growth in both the Mobility and Delivery segments. The company’s Gross Bookings increased 19% year-over-year to $31.4 Billion, with 2.1 Billion trips taken during the quarter.
The company’s Revenue rose 29% year-over-year to $8.8 Billion, outpacing Gross Bookings growth due to a change in the business model for its UK Mobility business. The company’s net loss was $157 Million, which includes a net benefit of $320 Million, mainly due to unrealized gains from its equity investments.
The company’s Adjusted EBITDA was $761 Million, up $593 Million year-over-year, with a margin of 2.4% of Gross Bookings. The company’s net cash provided by operating activities was $606 Million, and its free cash flow was $549 Million. The company’s unrestricted cash, cash equivalents, and short-term investments were $4.2 Billion at the end of the quarter.
UBER Stock Price Technical Analysis
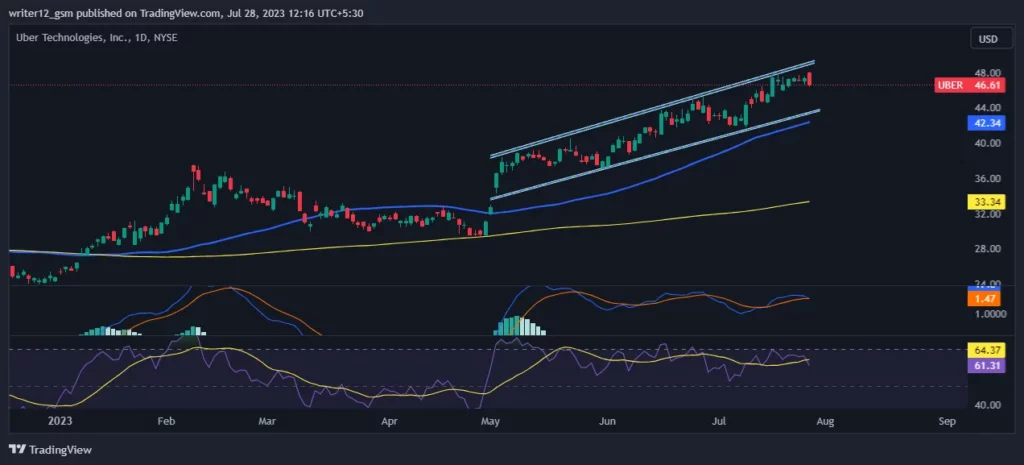
Uber stock price has risen above the 200-day and 50-day moving averages, indicating the dominance of the buyers in the market. However, if buyers keep pushing harder, UBER stock price could increase further and enter an uptrend. Furthermore, the bullish cross confirms the bullish trend on a daily time frame.
The RSI has been trading near the oversold zone. The RSI line is around 61.31. The 14 SMA line has a value of 64.37 points which shows that Uber Technologies, Inc.’s price is in the positive zone and is very bullish.
Currently, MACD is giving bullish signals. The MACD line (at 1.48) and the signal line (at 1.47) are above the zero line, suggesting that the MACD is in positive territory and is giving positive signals as of now.
Conclusion
UBER stock is displaying impressive performance and momentum in the market. Uber’s second-quarter projections for 2023 are promising. The stock is making higher highs and has already surpassed the 50- and 200-days moving averages on both daily and weekly time frames. The price, RSI, and MACD are all bullish, suggesting an uptrend and an optimistic outlook.
Technical Levels:
- Support – The current support level is $41.00.
- Resistance –The current resistance level is $49.00.
Disclaimer
The analysis given in this article is for informational and educational use only. Do not use this information as financial, investment, or as trading advice. Investing and trading in stock is a risky task. Please consider your circumstances and risk profile before making any investment decisions.

Nancy J. Allen is a crypto enthusiast, with a major in macroeconomics and minor in business statistics. She believes that cryptocurrencies inspire people to be their own banks, and step aside from traditional monetary exchange systems. She is also intrigued by blockchain technology and its functioning. She frequently researches, and posts content on the top altcoins, their theoretical working principles and technical price predictions.


