
 Home
Home News
News
- 1 JPM stock price has been recovering through an interesting rising pattern over the daily time frame chart.
- 2 JPMorgan Chase & Co. is a financial services firm based in New York City.
- 3 JPM shares are trying to sustain above the 100 and 200-day DMA to recover from the 20 and 50-EMAs.
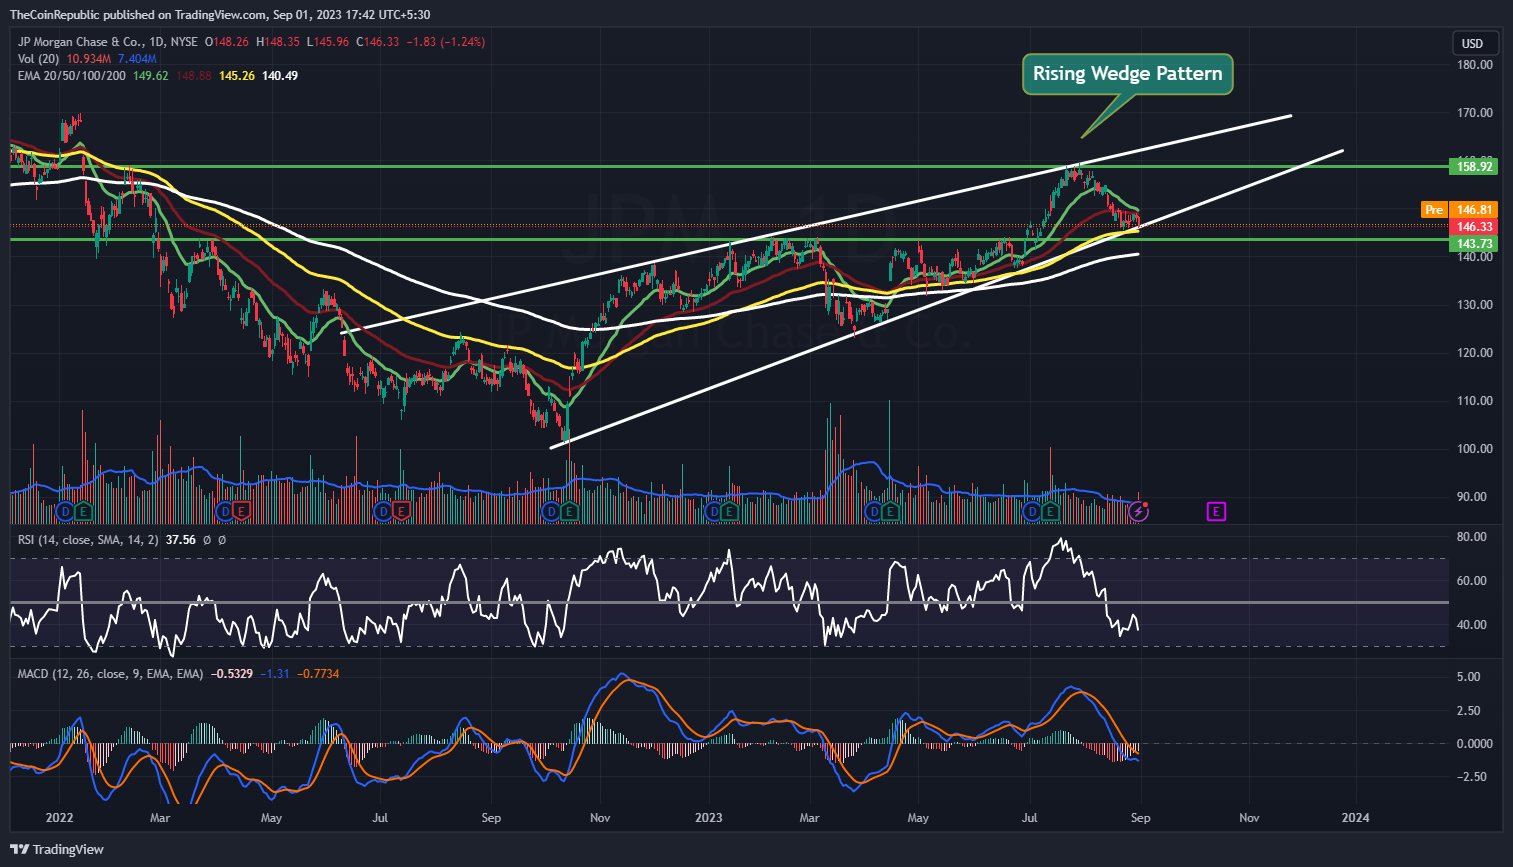
JPM stock price has been trading inside an interesting rising wedge pattern and is currently trying to sustain at the lower trendline. Meanwhile, sellers have been pulling JPM shares from the upper level to drag it through the lower trendline of the rising wedge pattern. JPMorgan Chase & Co. (NYSE: JPM) stock has been performing well while recovering through the rising wedge pattern and it is trying to recover to maintain its recovery phase inside the pattern.
JPM shares need to attract buyers in order to surge towards the upper trendline of the rising wedge pattern. Nevertheless, JPM stock has been falling from the upper trendline since the start of the month and fell back from the $158.92 resistance.
JPM stock price was at $146.33 and has lost 1.24% of its market capitalization during Thursday’s trading session. The trading volume has been below average and it needs to grow during the day’s trading session. This demonstrates that JPM needs to accumulate buyers in order to recover over the charts.
Will JPM Stock Bounce Back Now?
JPMorgan Chase & Co. Stock Analysis
JPMorgan Chase & Co. stock has been following a declining trend within the lower boundary of a rising wedge pattern. There’s potential for a reversal towards the upper trendline, but it hinges on an increase in buyer accumulation during the trading session. JPM stock needs a boost in accumulation to re-enter the pattern.
Over recent timeframes, JPM shares have witnessed fluctuations. In the past week, a slight 0.79% decline was observed, with a more significant 7.05% decrease over a month. However, the stock has displayed resilience over longer periods, marking gains of approximately 4.85% in the last three months and 3.41% in the previous six months.
Year-to-date, JPM’s share price has surged impressively by about 8.20%, reflecting a substantial recovery for the company’s stock in 2023.
Turning to technical indicators, they point to a downside trend for JPM shares. Both the RSI and MACD indicators validate this negative trend.
The RSI, currently at 37, is heading towards the oversold territory. Meanwhile, the MACD line sits below the signal line following a negative crossover.
Summary
JPMorgan Chase & Co. stock has been trading within an intriguing rising wedge pattern and is currently attempting to maintain its position near the lower trendline. However, it’s important to note that JPM stock has been on a decline since the beginning of the month, retreating from the upper trendline and reversing at the $158.92 resistance level. This recent price action indicates a degree of volatility in JPMorgan’s shares.
Technical Levels
Support Levels: $145.75 and $143.73
Resistance Levels: $149.55 and $153.70
Disclaimer
The views and opinions stated by the author, or any people named in this article, are for informational purposes only, and they do not establish financial, investment, or other advice. Investing in or trading crypto or stock comes with a risk of financial loss.

Andrew is a blockchain developer who developed his interest in cryptocurrencies while pursuing his post-graduation major in blockchain development. He is a keen observer of details and shares his passion for writing, along with coding. His backend knowledge about blockchain helps him give a unique perspective to his writing skills, and a reliable craft at explaining the concepts such as blockchain programming, languages and token minting. He also frequently shares technical details and performance indicators of ICOs and IDOs.


