
 Home
Home News
News

- Qash is trading in a bullish momentum and showing signs of strength and built-up
- The pair of QASH/BTC is trading flat at 0.000001347 BTC, while the pair of QASH/ETH is trading at 0.00003206 ETH
- It is currently placed at the 529th rank
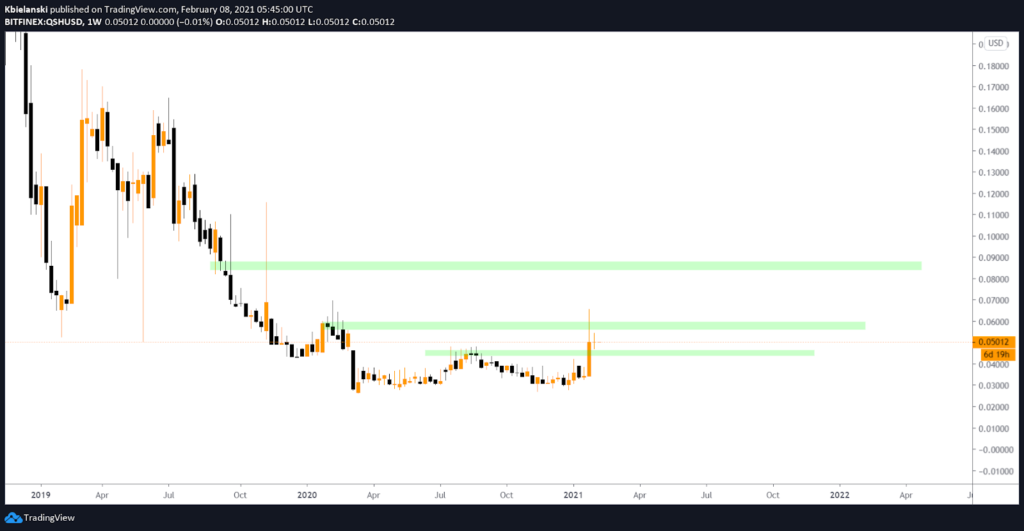
QASH, over the weekly time frame, is trading on a bullish note, and a breakout is observed above the first resistance levels. However, presently it is consolidating, before moving further in the upcoming trading sessions. After taking support from 50-Day Moving Averages (DMA), QASH is trading above all the major moving averages of 20,50,100, and 200-DMA which indicates the bullish momentum over the monthly chart. It is currently placed at the 529th rank according to the total market capitalization, whereas market capitalization stands at $18,289,561 with an intraday drop of -2.27%.

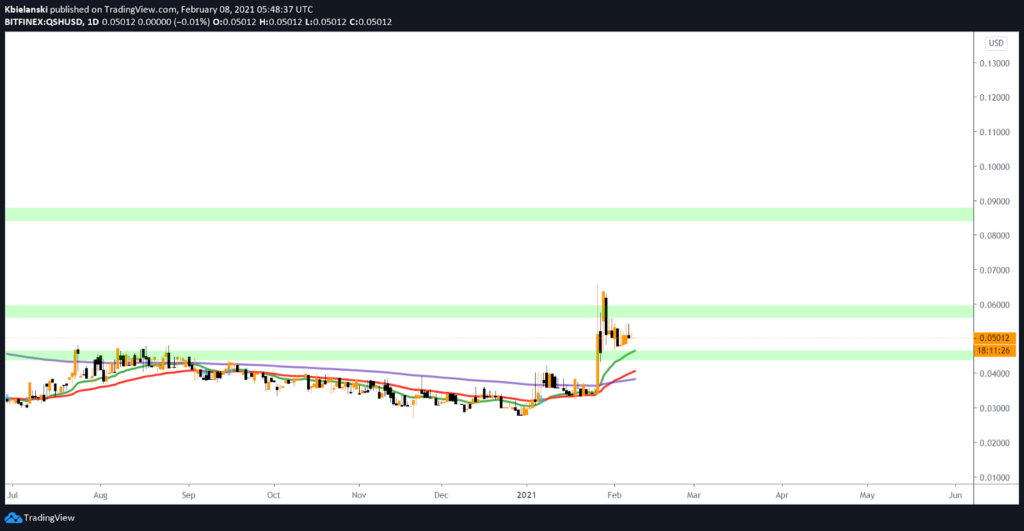
QASH, on the daily time frame, reached near the 2nd resistance level of $0.060, after clearing its 1st resistance of $0.045 level. Meanwhile, the overall trend is still in favor of bulls as QASH is trading above major Exponential Moving Averages of 20, 50, and 200-Day. However, EMA of 20 and 50 are trading above the EMA of the 200-day, generating a bullish momentum for upcoming trading sessions. The critical support which QASH needs to hold is $0.0472, and the levels expected in upcoming trading sessions are $0.057 and $0.085.

Relative Strength Index (Bullish) indicates a bullish momentum while trading at 65.65. However, it is currently trading flat near the overbought zone after recovering from lower levels.
Moving Average Convergence Divergence (Bullish) currently indicates a bullish trend on the daily chart as giving a positive crossover with the significance of Buyer’s line (green) over seller’s signal line (red) with no sign of weakness.
Support levels: $0.0472 and $0.0450
Resistance levels: $0.060


