
 Home
Home News
News
- KuCain Price has gained around 35.68% of its market capitalization throughout the week.
- The crypto asset has completely recovered above 20 and 50 SMA, however, 100 and 200-days Daily Moving Average are remaining bullish hurdles.
- The pair of KCS/BTC is at 0.0005764 BTC with an intraday gain of 0.28%.
KuCoin price has been trading inside the horizontal range-bound area over the daily chart. Despite being in the consolidation phase, the token has gained around 35% this week, neglecting the over-hyped fear of a bear market all around the cryptocurrency market. KuCoin just got up among the top gainers of this week and justified its existence. KCS coin price is still inside the consolidation phase, and it must escape the long-term consolidation phase by maintaining the uptrend momentum over the chart.

KuCoin price is presently CMP at $17.00 and has lost 0.25% of its market capitalization in the last 24-hour period. Trading volume has decreased by 43% in the intraday trading session. This shows that bears are trying to oppose the momentum and are trying to pull the token back. Bears are on the move now, and bulls are losing their grip over the KCS coin. The volume to market cap ratio is 0.003379.

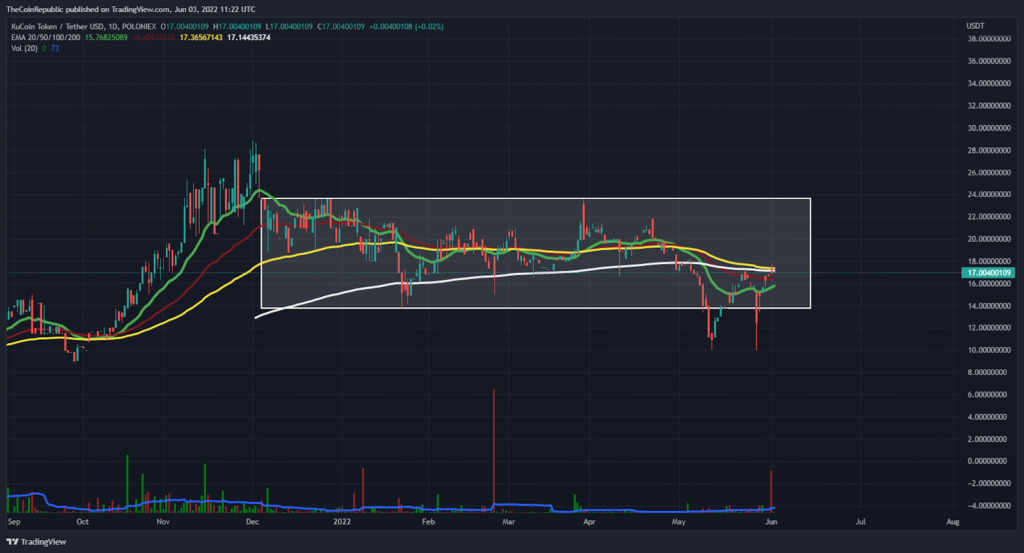
KCS coin price is trying to escape the consolidation phase over the daily chart. However, the token is facing selling pressure over the chart. Volume change can be seen below average and needs to grow for KCS to move towards the upper trendline of the horizontal range-bound area. KCS bulls need to accumulate themselves to gain over the daily chart. The crypto asset has completely recovered above 20 and 50 SMA, however, 100 and 200-days Daily Moving Average are remaining bullish hurdles.
What do Technical Indicators Suggest about KCS?
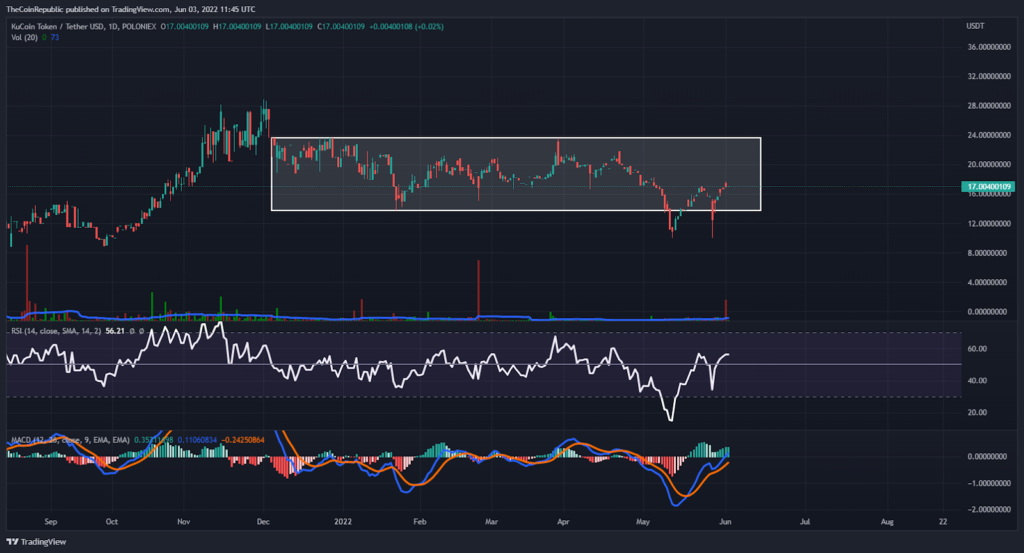
KuCoin price has been caged inside the horizontal range-bound area since December 2021. The token seriously needs to escape the token by gaining strong uptrend momentum in 2022. KCS bulls must accumulate themselves to register the token’s breakout. Technical indicators suggest the uptrend momentum of the KCS coin. However, the Relative Strength Index showcases that the KCS coin is heading towards the overbought territory as its surpassed neutrality.
Meanwhile, MACD exhibits the uptrend momentum of the KCS coin. The MCAD line is entering the positive zone through zero. KCS investors need to wait for any directional change over the daily chart.
Conclusion
KuCoin price has been trading inside the horizontal range-bound area over the daily chart. Despite being in the consolidation phase, the token has gained around 35% this week, neglecting the over-hyped fear of a bear market all around the cryptocurrency market. KuCoin price has been caged inside the horizontal range-bound area since December 2021. Technical indicators suggest the uptrend momentum of the KCS coin. KCS investors need to wait for any directional change over the daily chart.
Technical Levels
Support Level: $13.00 and $10.00
Resistance Level: $20.00 and $23.00
Disclaimer
The views and opinions stated by the author, or any people named in this article, are for informational ideas only, and they do not establish the financial, investment, or other advice. Investing in or trading crypto assets comes with a risk of financial loss.

Nancy J. Allen is a crypto enthusiast, with a major in macroeconomics and minor in business statistics. She believes that cryptocurrencies inspire people to be their own banks, and step aside from traditional monetary exchange systems. She is also intrigued by blockchain technology and its functioning. She frequently researches, and posts content on the top altcoins, their theoretical working principles and technical price predictions.


