
 Home
Home News
News
Uniswap is a cryptocurrency exchange using a decentralized protocol. It facilitates the trading of tokens on the Ethereum network.

Q2 was a highly volatile quarter, mainly impacted by FUD– Fear, uncertainty and doubt. Many events, such as 3AC(Three Arrows Capital) going bankrupt and the entire web3 community acknowledging the possibility of insolvency among centralized parties, led to the crashing down of cryptocurrency market capitalization.

Q2 started with a market capitalization of $2 Trillion and ended with just $870 Billion.
Here’s a detailed analysis: Uniswap Q2 Report 2022.
Uniswap Daily Transaction Volume
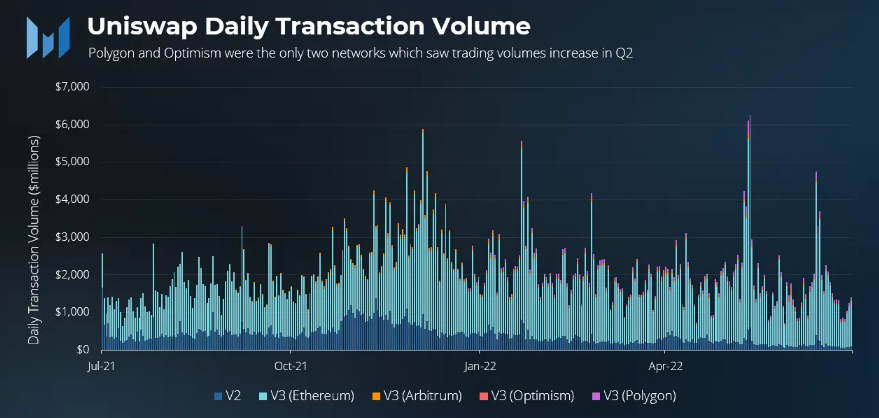
Compared to the previous Quarter, Uniswap’s trade volume fell 8.7%. This is a far better data statistic than the larger cryptocurrency market capitalization, which crashed down more than 50%.
One of the biggest reasons Uniswap didn’t have to go through that is volatility. This Quarter was one of the most disappointing in the history of the cryptocurrency market. This volatility is very beneficial for Decentralized exchanges, commonly known as DEXs, such as Uniswap. This is because during the downturn of the markets, users require DEXs’ services.
It’s positive news that DEXs have matured in the past two years. This is proved by the fact that, finally, the trade volumes are determined by price efficiency—asset price reflecting the true value— and not based on speculations done by retail investors.
Uniswap Daily Market Liquidity
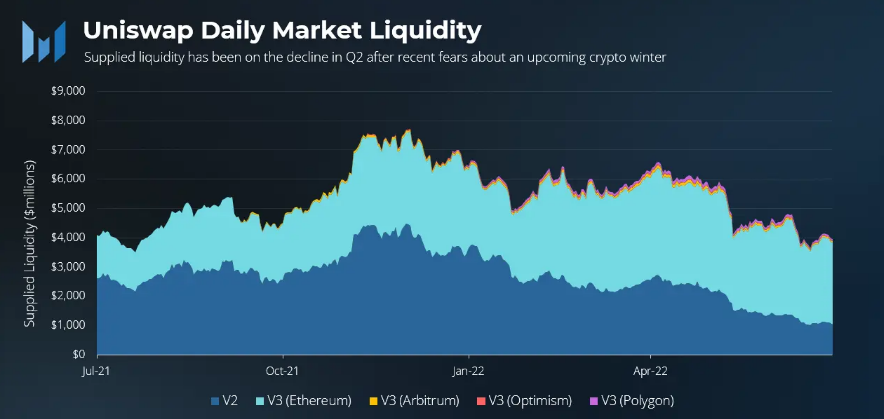
The liquidity supplied on Uniswap performed far better than the total market capitalization. The liquidity of Uniswap outperformed other crypto asset prices. The liquidity crashed by 37.1%. Benchmarking against ETH, the liquidity of Uniswap is rated far better. This statement is in reference to the fact that during the same Q2, ETH fell almost 70%.
Uniswap Daily Liquidity Provider Fees
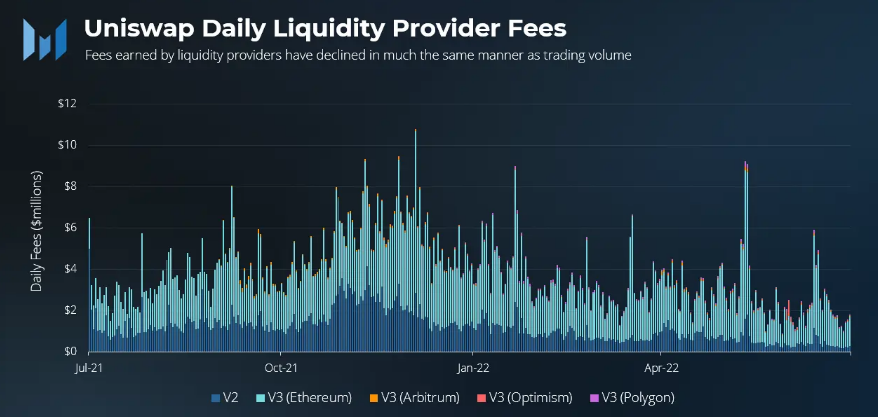
Lower trading volume is directly proportional to lower fees. With respect to quarter Q1, the liquidity provider fees went down 21.9%. Optimism has shown the highest Liquidity Provider fees, whose fees have grown over 146.9% this Quarter. This refers to the growth from $1.4 million to $3.5 million.
The largest decline in the market has been- Arbitrum. This is another Uniswap L2 scaling solution. The liquidity provider fees earned on Arbitrum with respect to Optimism were four times during Q1. This became infinitesimally small during this Quarter. This is the power of OP airdrop(governance token).
1 Basis Point Volume On Ethereum vs. Polygon
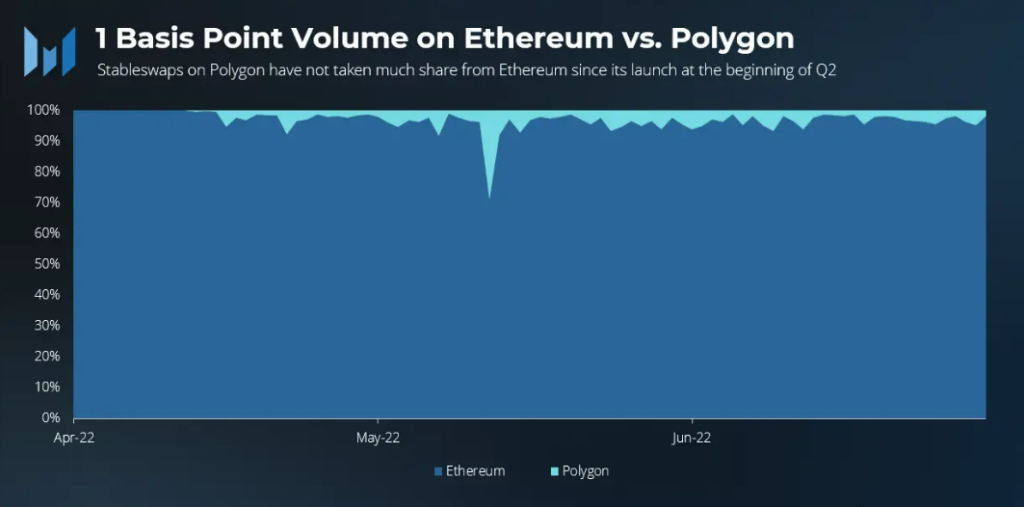
The choice to include a one bps layer on Polygon, Uniswap’s second-most-popular blockchain, is among the most important developments from the quarter. The reasoning is simple: this low charge tier has taken a larger portion of the stable swap market, and Polygon is still a well-liked network for low-cost transactions. This governance choice hasn’t exactly been a huge success thus far. Compared to 5.3 per cent for the whole trading volume of V3, just 2.3 per cent of one bps fee stableswaps occur on Polygon.
Conclusion
Q2 has turned out to be one of the worst quarters in the history of the cryptocurrency market. But, according to the data given above, Uniswap has outperformed the major currencies and their markets. This proves the fact that Uniswap has made itself the cradle of the crypto economy.
Steve Anderson is an Australian crypto enthusiast. He is a specialist in management and trading for over 5 years. Steve has worked as a crypto trader, he loves learning about decentralisation, understanding the true potential of the blockchain.


