
 Home
Home News
News

- AAVE price falters to maintain the uptrend momentum and to sustain the falling wedge pattern.
- AAVE crypto recovered till 20 EMA and now falters to maintain its current position.
- The pair of AAVE/BTC is at 0.003625 BTC with an intraday gain of 5.94%.
AAVE price just successfully escaped out of the falling wedge pattern over the daily price chart. The token now falters to maintain its position and it looks like AAVE may lose the current uptrend momentum over the daily chart. AAVE coin must maintain itself out of the falling wedge pattern and do so AAVE needs to draw more buyers to sustain. However, AAVE bears may interrupt the token’s uptrend momentum to try for a pullback. AAVE investors need to wait for any directional change over the daily price chart.

AAVE Crypto’s projected price as of right now is $69.10, and on the last day, its market capitalization increased by 1.75%. The volume of trades increased by 2.42% during intraday trading. This shows how AAVE bulls are trying to build up so that the currency can start to bounce back with uptrend momentum. The volume to Market capitalization ratio is 0.6117.

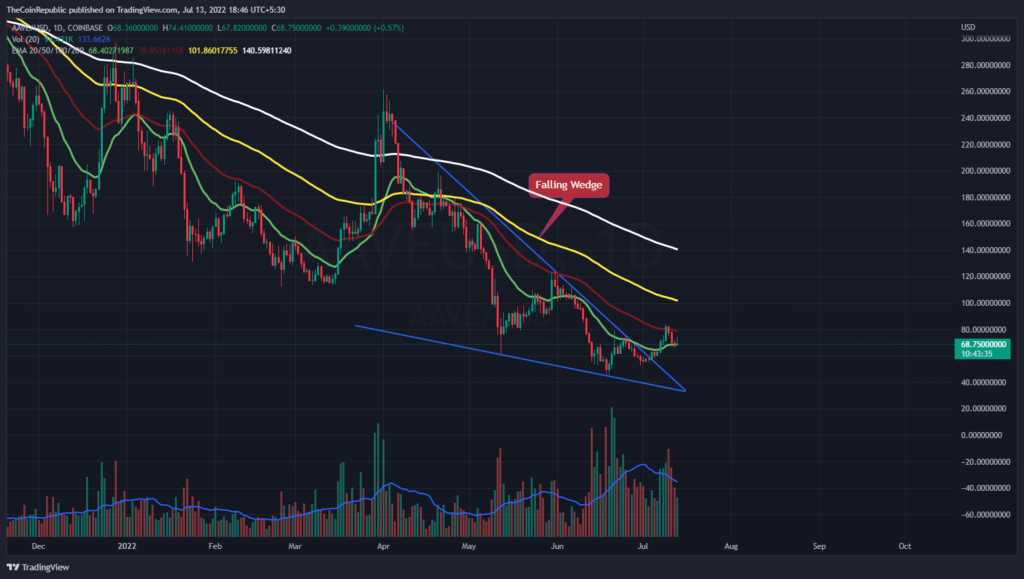
The price of the AAVE coin is trying to go up near the upper trendline of the consolidation phase. More buyers are needed for the token to move out of the region that is horizontal range-bound. Bulls in AAVE need to get together for the token to cross the daily price chart. For AAVE to become independent, the volume change must improve as it is now below average.
What do Technical Indicators Suggest about AAVE?
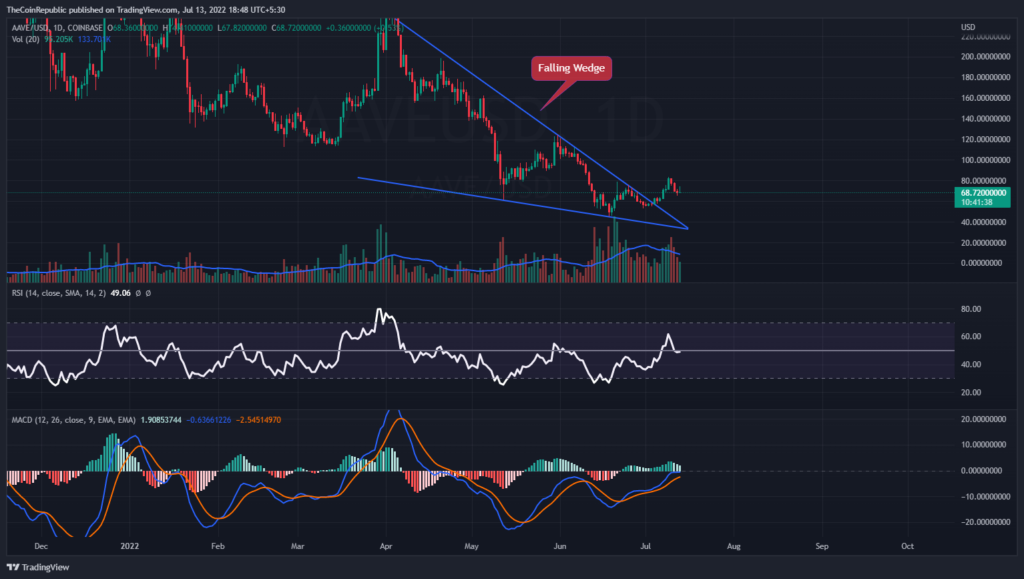
AAVE is trying to surge over the daily price chart. Technical Indicators suggest the sideways momentum of AAVE out of the falling wedge pattern. The relative Strength Index showcases the sideways momentum of the AAVE coin. RSI is at 48 and is nearing neutrality to signal any directional change to conclude the price action of the AAVE coin. MACD exhibits the consolidation phase of the AAVE coin. The MACD line is heading towards the signal line for a negative crossover. AAVE investors need to wait for any directional change over the daily price chart.
Conclusion
AAVE price just successfully escaped out of the falling wedge pattern over the daily price chart. The token now falters to maintain its position and it looks like AAVE may lose the current uptrend momentum over the daily chart. AAVE coin must maintain itself out of the falling wedge pattern and do so AAVE needs to draw more buyers to sustain. Bulls in AAVE need to get together for the token to cross the daily price chart. The volume change must improve for AAVE to become independent as it is now below average. Technical Indicators suggest the sideways momentum of AAVE out of the falling wedge pattern. RSI is at 48 and is nearing neutrality to signal any directional change to conclude the price action of the AAVE coin. MACD exhibits the consolidation phase of the AAVE coin. AAVE investors need to wait for any directional change over the daily price chart.
Technical Levels
Support Levels: $65.00 and $60.00
Resistance Levels: $78.00 and $83.00
Disclaimer
The views and opinions stated by the author, or any people named in this article, are for informational ideas only, and they do not establish the financial, investment, or other advice. Investing in or trading crypto assets comes with a risk of financial loss.

Nancy J. Allen is a crypto enthusiast, with a major in macroeconomics and minor in business statistics. She believes that cryptocurrencies inspire people to be their own banks, and step aside from traditional monetary exchange systems. She is also intrigued by blockchain technology and its functioning. She frequently researches, and posts content on the top altcoins, their theoretical working principles and technical price predictions.


