
 Home
Home News
News

- IOTA is going with the flow along with the market as it is rising when the market does and collapsing alongside with it.
- IOTA/BTC pair is also showing negative signs with a loss of -0.77% bringing the level to 0.00002495.
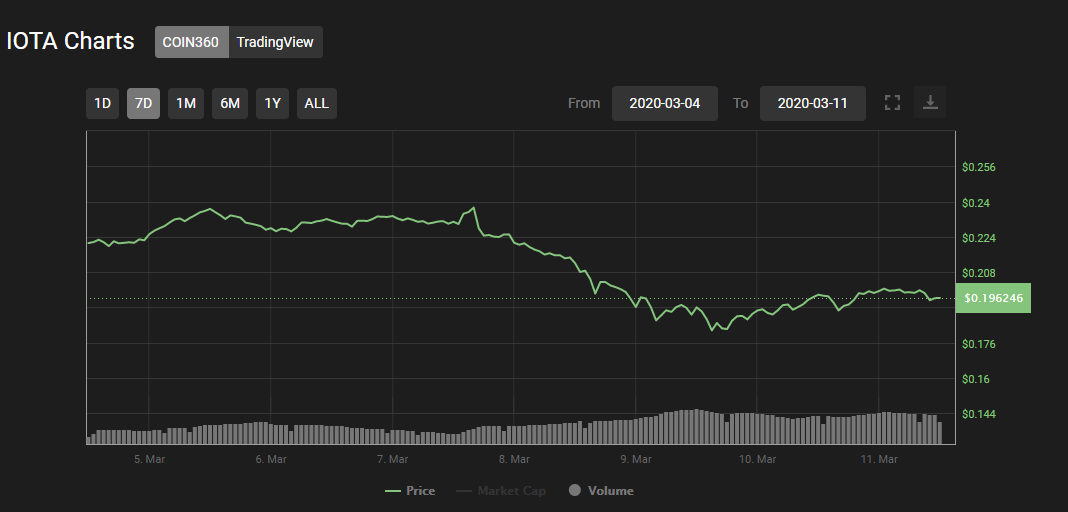
On the 7 days weekly chart, IOTA started with $0.195759 with a bullish approach, and it went up to $0.200939 today’s highest point. Then gradually start suffering the ups and downs of the market.

The support level of $0.195759 tried its level best to support the altcoin but eventually, it failed when coin acquired a heavy bearish flow.

IOTA Technical Analysis
The technical chart shows many fluctuations in the price of IOTA on the following day. This up and downstate of IOTA’s chart ended in a negative manner.
The technical oscillator ended on neutral zone but moving average shows heavy sell in the altcoin.
The MACD level is again bearish zone due to heavy sell in the altcoin. The 24hr RSI is also in the negative state going towards the bearish zone. The 24hr CCI ended on a neutral note after having a negative diversion.
Resistance level: $0.201000
Support level: $0.197908 and $0.195759
Mr. Pratik chadhokar is an Indian Forex, Cryptocurrencies and Financial Market Advisor and analyst with a background in IT and Financial market Strategist. He specialises in market strategies and technical analysis and has spent over a year as a financial markets contributor and observer. He possesses strong technical analytical skills and is well known for his entertaining and informative analysis of the Financial markets.


