
 Home
Home News
News
- Chainlink showed a significant positive momentum in today’s market with 9.00% growth.
- The cryptoasset has also reclaimed the crucial mark of $2.00 indicating future bullish movement.
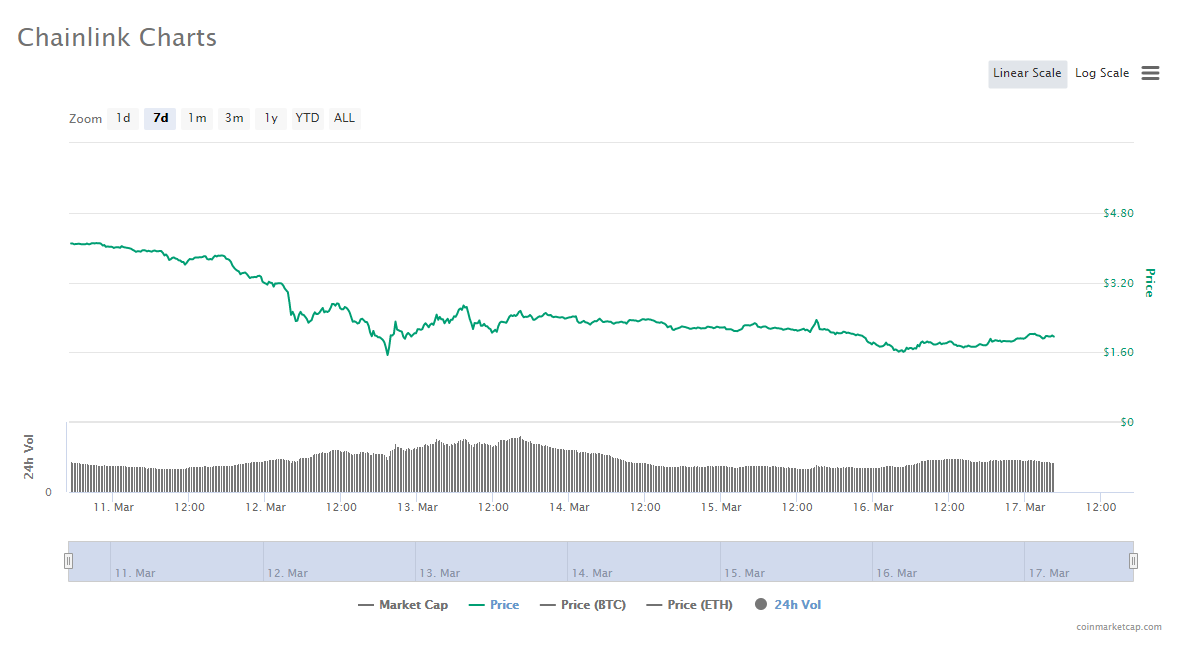
On the 7day-weekly chart, Chainlink started with a strong level of $4.00 but the overall bearish movement in the market has brought the price of the altcoin into major critical points.
The cryptoasset went down to the lowest of $1.70 where it found major support and now the price level is back again to a safe spot of $2.00
From here on, chainlink can sustain the price mark of $2.00 and build on bullish momentum to the level of $3.00. However, it will be facing a minor resistance of $2.70 in the price growth process.
As of now, chainlink is now having a strong support level of $2.00. Any price fall below the price mark will again result in a major downfall for the altcoin.
Chainlink Technical Analysis
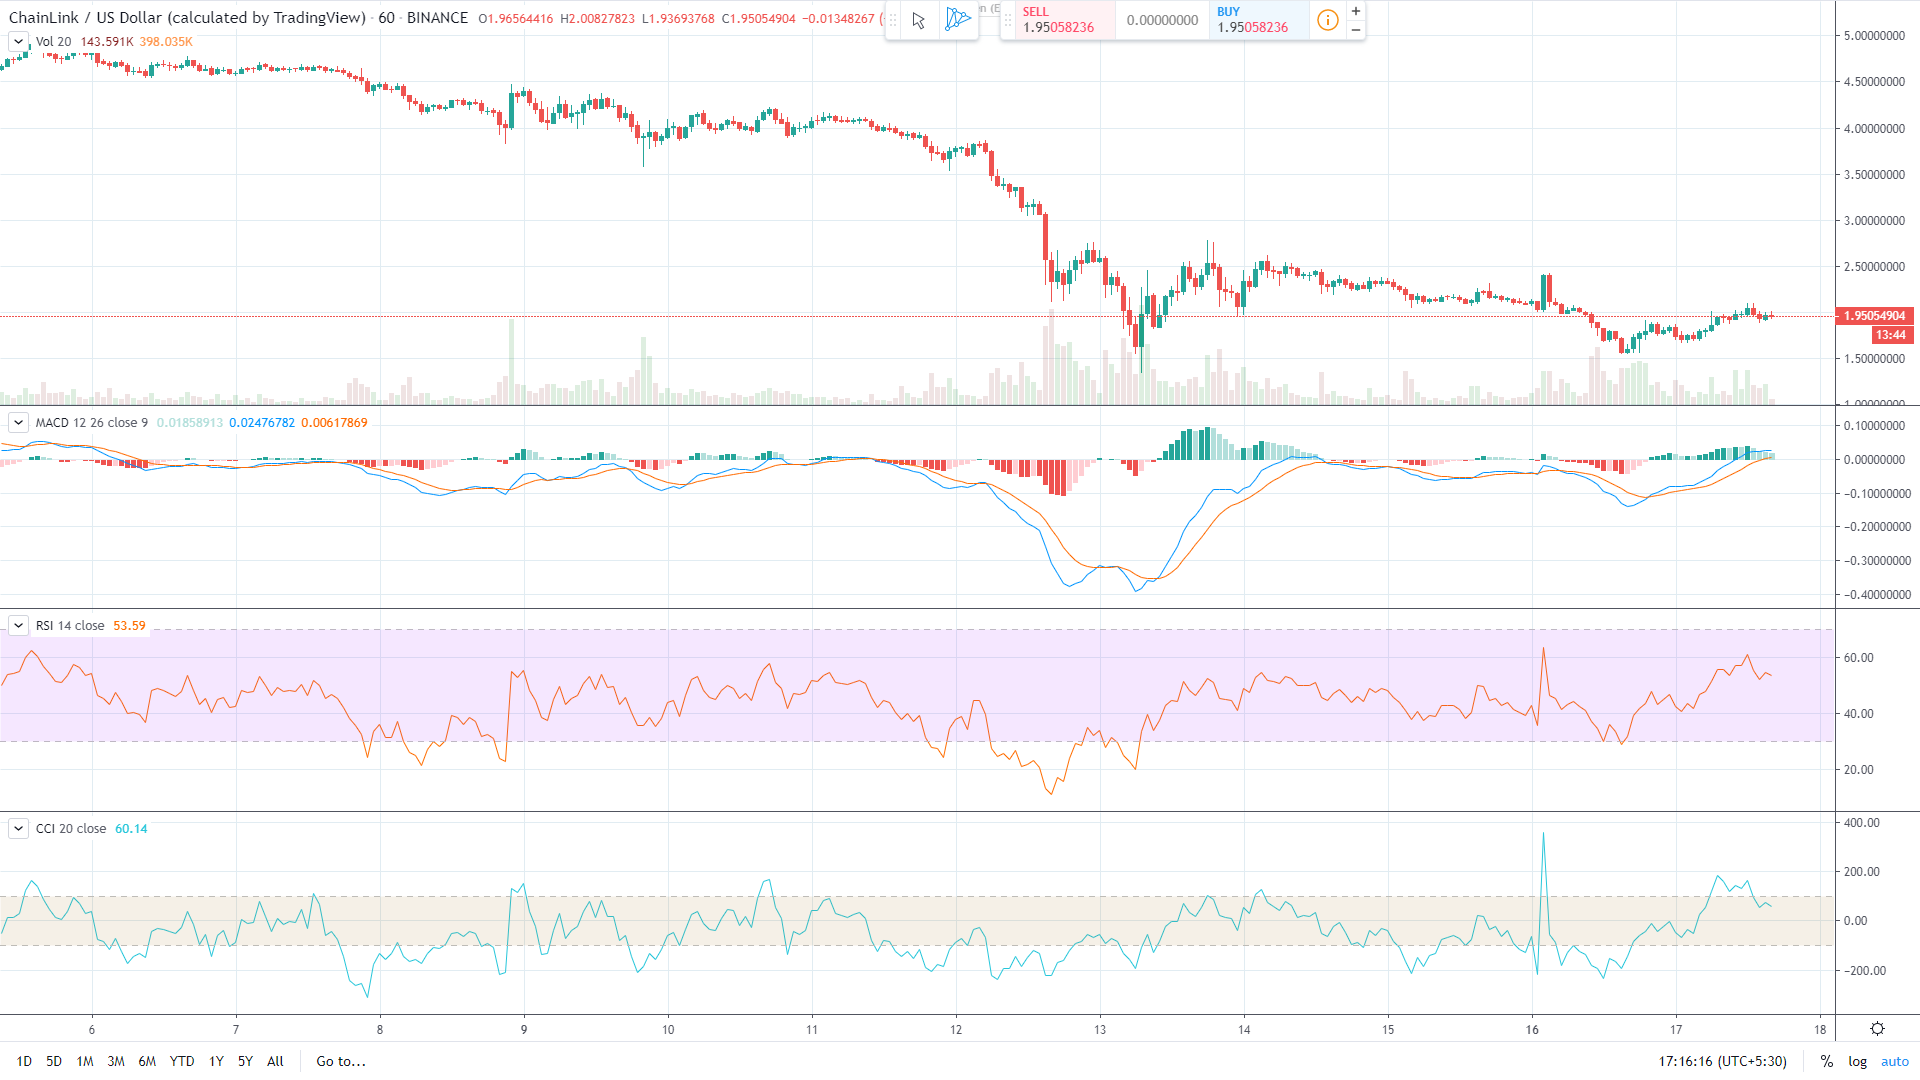
The technical graph reflects the heavy downtrend faced by chainlink which forced a huge drop from the price level of $4.00 to the level of $1.70.
The MACD levels are reaching a bullish zone which is a positive sign for the cryptoasset. This means that LINK bulls are hitting more impact than the previous attempt.
The 24hr- RSI is showing downtrend nature with the level of 55. Any further downfall below the level of 45 will invite bears into play again
The 24hr-CCI had a negative divergence from the overbought region and is able to sustain it in the normal zone. But any further downfall which brings the levels close to the oversold region will provide a negative impact on the altcoin.
Resistance level: $2.50 and $2.70
Support level: $2.00 and $1.70
Steve Anderson is an Australian crypto enthusiast. He is a specialist in management and trading for over 5 years. Steve has worked as a crypto trader, he loves learning about decentralisation, understanding the true potential of the blockchain.


