
 Home
Home News
News

- 1 The MMAI token price shows a double bottom formation near the demand zone.
- 2 Buyers are trying to escape the 20-day EMA to regain momentum.
The MMAI token (MetamonkeyAi) delivers a rebound from the lows of $0.0009000, replicating renewed buying interest in the last sessions. For the past weeks, the token has hovered inside a narrow range below the 20-day EMA mark. It has recently retested the demand zone and bulls have regained their strength, which is reflected by the sudden spike near the lows.

The token is trading close to the 20-day EMA mark, revealing a downtrend on the charts. Moreover, the token persisted in forming the lower low sequences and has justified bearishness over the past months. The token traded in the bearish region and did not attain any noteworthy rebound for the past sessions. However, the token managed to halt the selloff and is preparing to claim the nearby swing hurdles of $0.0001300.

The cryptocurrency price was $0.0001228 at press time with an intraday gain of 2.55%, showing bearishness on the charts. Moreover, the trading volume increased by 4.56% to $33,125, highlighting selling pressure. The pair of MMAI/BTC was noted at 0.00000000274 BTC and its market cap is $1.23 Million. Analysts are neutral and suggest that the MetaMonkeyAi (MMAI) token may retain the neutral region above $0.00014000 in the following sessions.
MMAI on Daily Charts Displays Consolidation Near Lows
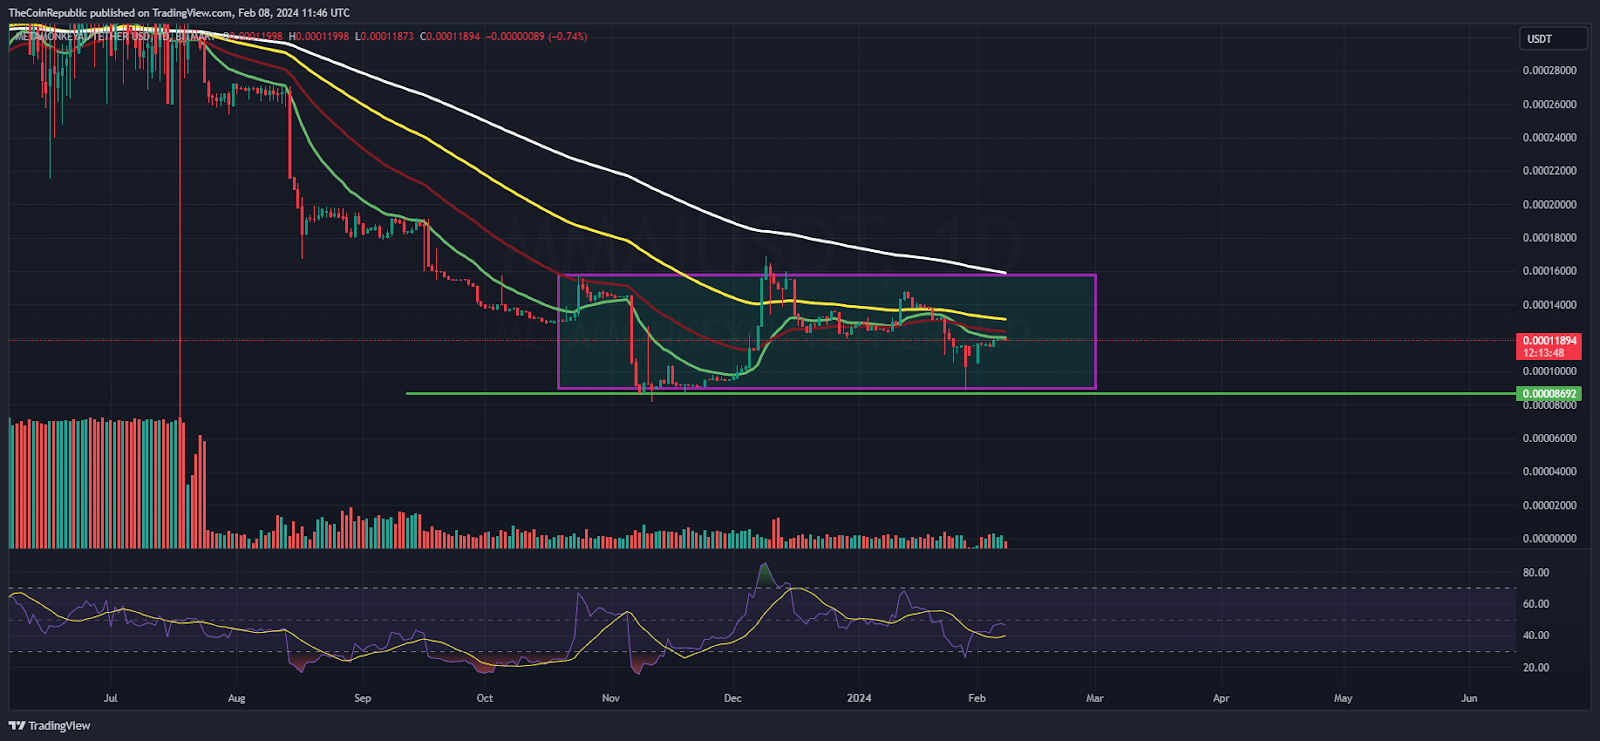
On the daily charts, the MMAI token signifies weakness and replicates distribution from the highs, indicating the bears’ dominance. Despite the bulls’ efforts to retain momentum, buyers found it challenging to escape the 100-day EMA mark above $0.0001500 and stayed in the bearish region which justified the selloff.
The Relative Strength Index (RSI) curve shows a rebound from the oversold region to the midline and replicates a positive crossover. Moreover, the MACD indicator shows a bullish crossover and formed green bars, which is a sign of renewed bull strength. Per the Fib levels, the token has held the 23.6% zone for the past weeks and is ready to retest the 38.2% level.
MMAI on Weekly Charts Exhibits Downtrend
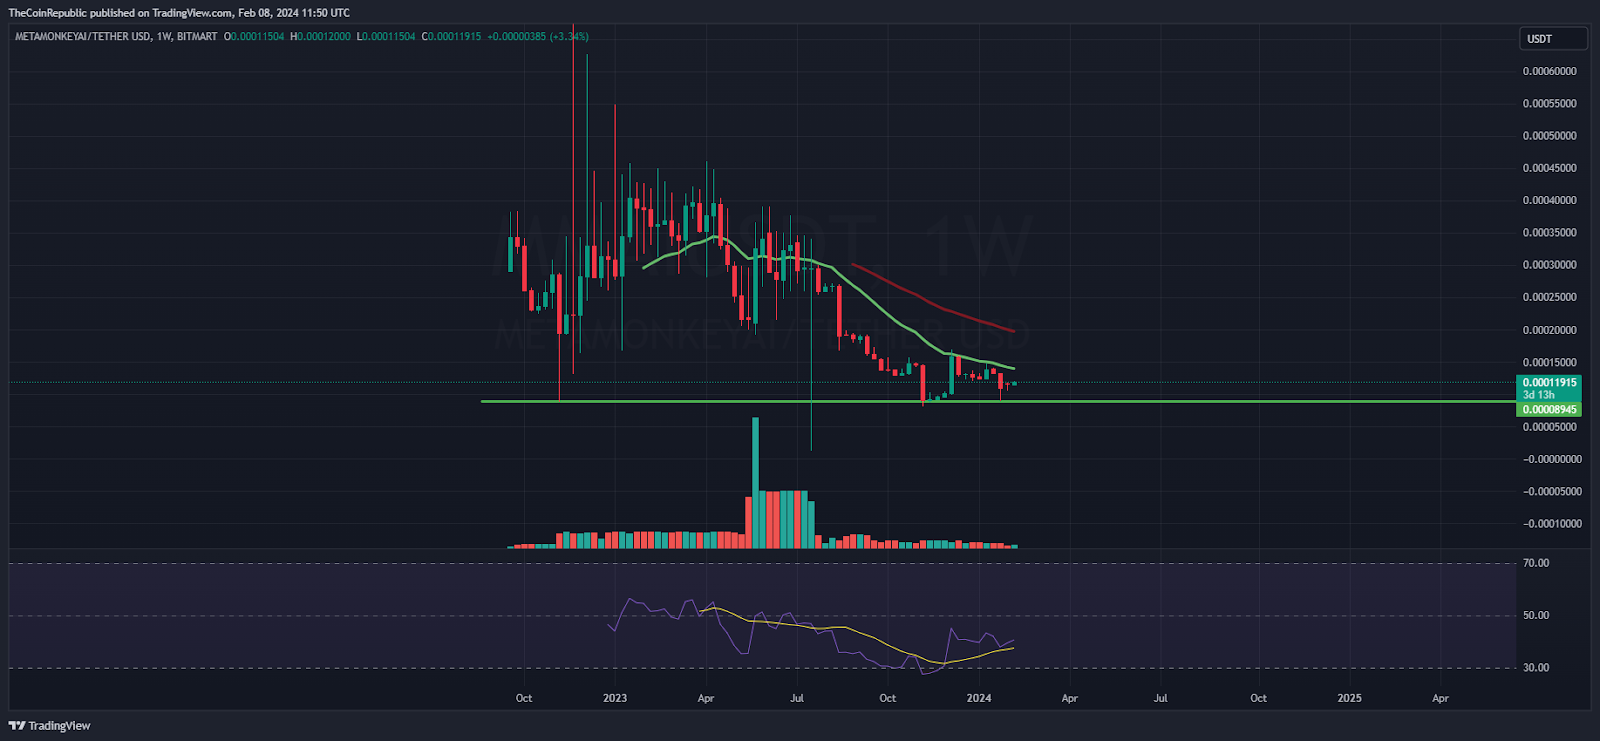
The MMAI price was close to the demand zone of $0.0001200 on the weekly charts and formed a doji candlestick, which signifies buyers’ attempt to regain strength. If bulls surpass the 20-day EMA mark, a short covering move will lift the token above $0.00014000 on a short-term view and may exceed $0.0001600. Conversely, if it breaks $0.0001180, a free fall can be anticipated to $0.0001000.
Summary
The MMAI price hovered in a range close to the demand zone of $0.0001200 and is witnessing a downtrend on the charts. Moreover, the token was under the sellers’ control and did not succeed in attaining a pullback despite multiple efforts, which signifies intense selling pressure.
Technical Levels
Support Levels: $0.0001180 and $0.0001000
Resistance Levels:$0.0001300 and $0.0001500
Disclaimer
The views and opinions stated by the author or any other person named in this article are for informational purposes only and do not constitute financial, investment, or other advice. Investing in or trading crypto or stocks comes with a risk of financial loss.
Steve Anderson is an Australian crypto enthusiast. He is a specialist in management and trading for over 5 years. Steve has worked as a crypto trader, he loves learning about decentralisation, understanding the true potential of the blockchain.


