
 Home
Home News
News

- Stellar Price is suffering major price corrections due to the overall downtrend in the cryptomarket.
- Currently, it is facing an overall loss of -1.78%.
- The stellar coin price chart reflects on the downtrend of the altcoin which has become more significant this month due to overall market conditions.
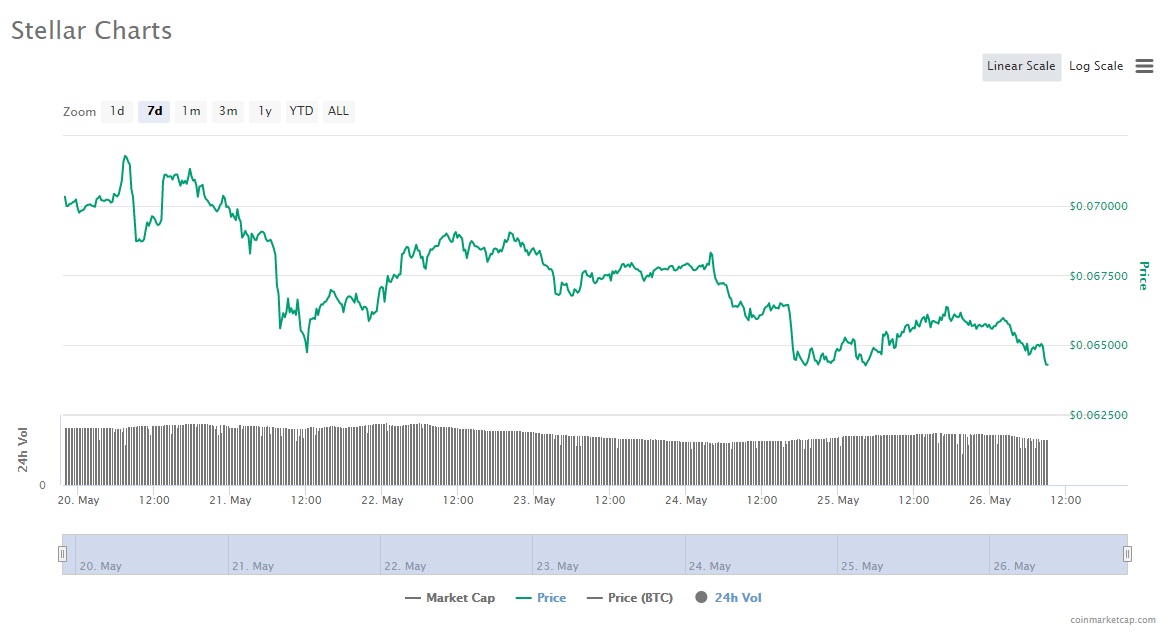
As reflected in the pricing graph, Stellar Lumens XLM is having a significant bearish movement in today’s market. The altcoin broke down the crucial level of $0.065. The downtrend is so significant that it has brought the cryptoasset to the major support level of $0.060.

XLM bulls, somehow, had the support at the price level of $0.060 and went up to the price level of $0.064. However, the overall market forces pushed XLM down to the major support level of $0.062. The market cap is $1,249,413,749 and volume traded is $392,116,808.

The ongoing current downtrend in the market is again bringing the majority of the coins to their lowest possible level for the month. The XLM/BTC pair is also having negative movement of -1.16% with the level of 0.000000732 BTC.
Stellar Lumens Technical Analysis
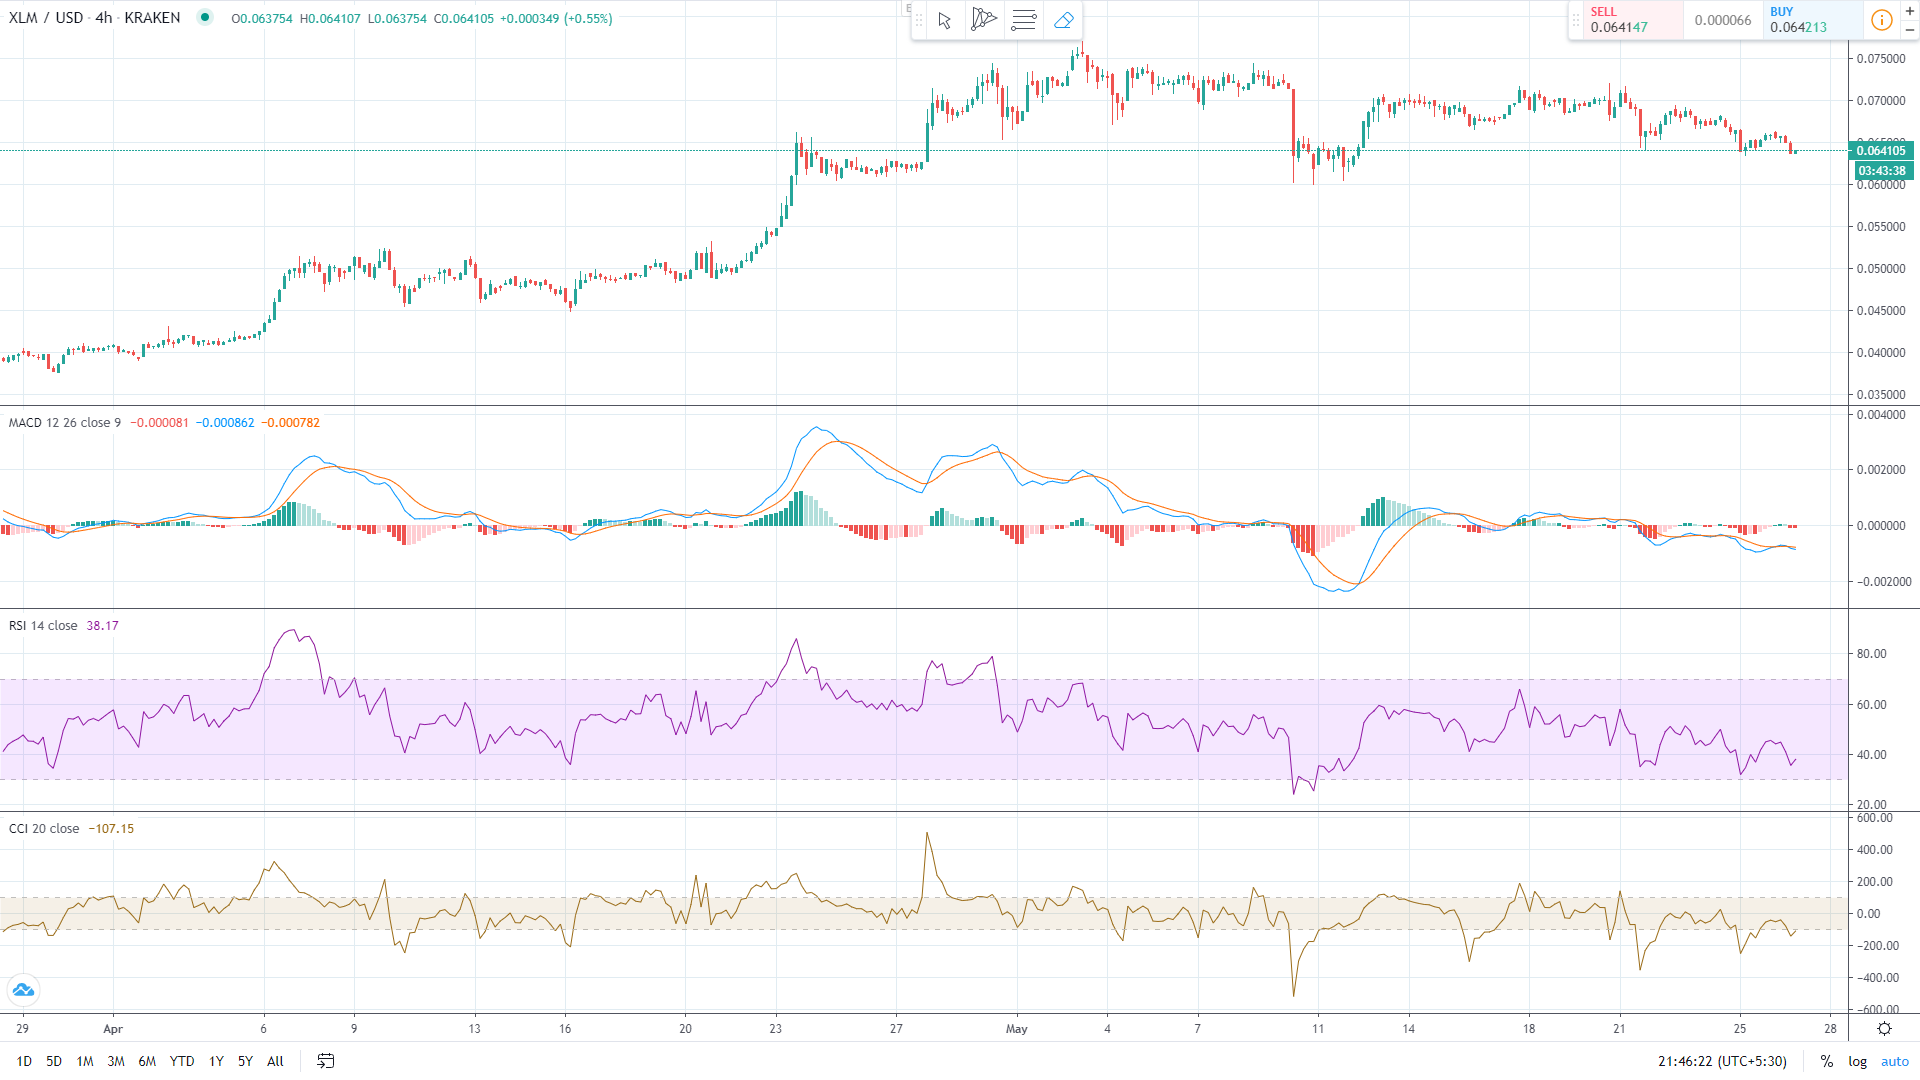
The Stellar Lumens XLM price chart reflects on the downtrend of the altcoin which has become more significant this month due to overall market conditions. The graph also suggests that XLM has tried to maintain its sustainability at different support levels but failed due to the overall bearish movement in the market.
The technical indicators and oscillators suggest that the crypto market will see the color of red in upcoming days for XLM.
The MACD levels are again brought back to the bearish nature after reaching a bullish region through lots of efforts.
The 24hour- RSI is again showing downtrending nature which is not a positive sign for the altcoin. A break below the level of 30 will provide more bearish momentum.
The 24hour-CCI touched the oversold region. However, the positive divergence looked strong to reach the normal territory but failed. This indicates that bears are on the stronger side and XLM can face further downfall.
Resistance level: $0.070
Support level: $0.062 and $0.060
Mr. Pratik chadhokar is an Indian Forex, Cryptocurrencies and Financial Market Advisor and analyst with a background in IT and Financial market Strategist. He specialises in market strategies and technical analysis and has spent over a year as a financial markets contributor and observer. He possesses strong technical analytical skills and is well known for his entertaining and informative analysis of the Financial markets.


