
 Home
Home News
News

- Ethereum (ETH) is trading under critical area after facing the resistance of the sloping line placed below the 50-Day Moving Average.
- The pair of XRP/BTC is standing at 0.03065132 BTC with an intraday gain of +2.49%
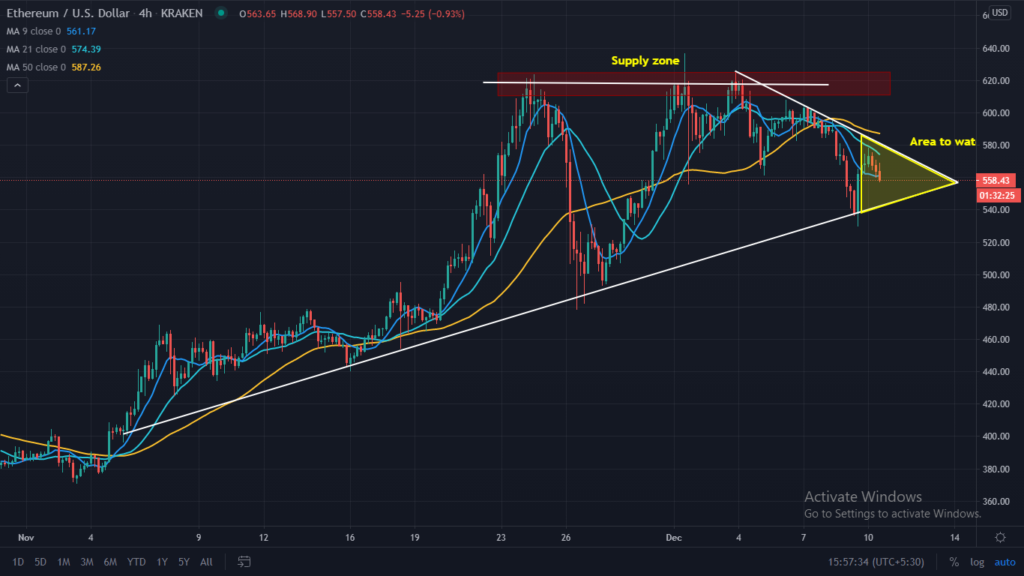
Ethereum (ETH) after a bullish movement is now trading under the critical area. After a bullish rally in the crypto market, Ethereum hits its new 52-week high of $635. A sharp profit booking is seen in it where it re-tested the rising support line and again bounced back is seen, but at higher levels, a supply zone is created where it is unable to sustain; as a result, it slips from there. Currently, it is training under the 50-DMA, which indicates its bearish nature for the short term. For a bullish move, it must trade above 50-DMA and must break the upper resistance line. The support on the lower side is placed at $495, and $375 can be considered as strong support. On the higher side resistance is placed at $635.

The daily chart of Ethereum (ETH) is trading under the range of $548 to $57, and currently, it is trading under 9, 21 and 50-Day moving averages. ETH is trading at $558.23 with a marginal gain of +1.82%, supported by the volume traded in last 24-Hours of $13,053,634,879 and the total market capitalization stands at $63,594,508,736. While in the last seven days it losses over -7.72%.

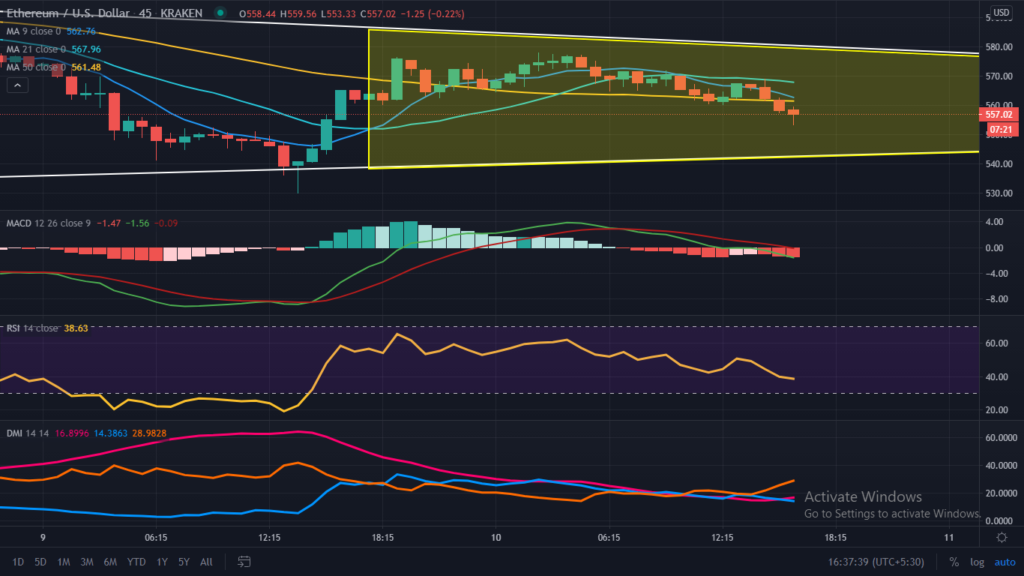
The Relative Strength Index (RSI) indicates the strength of XRP is trading at 38.70 trading flat after testing the overbought zone.
Directional Movement Index (DMI) is trading with a mixed-signal as +DI and -DI not providing a clear signal for the short term, however the significance of -DI is moreover +DI.
Moving Average Convergence Divergence (MACD) indicates the trend. Currently, it indicates the bearish trend on the intraday chart as gives a negative crossover with the significance of Bear’s line (red) over Bull’s line (blue) indicating the bearish trend for the short term.
Support levels: $495 and $375
Resistance levels: $635
Join The Coin Republic’s Telegram Channel for more information related to CRYPTOCURRENCY NEWS and predication.
Mr. Pratik chadhokar is an Indian Forex, Cryptocurrencies and Financial Market Advisor and analyst with a background in IT and Financial market Strategist. He specialises in market strategies and technical analysis and has spent over a year as a financial markets contributor and observer. He possesses strong technical analytical skills and is well known for his entertaining and informative analysis of the Financial markets.


