
 Home
Home News
News

- XRP on monthly chart after a bullish move is now trading under the pressure of selling as making higher highs and lower lows
- The pair of XRP/BTC is also performing well at 0.00003102 BTC with an intraday gain of +2.49%
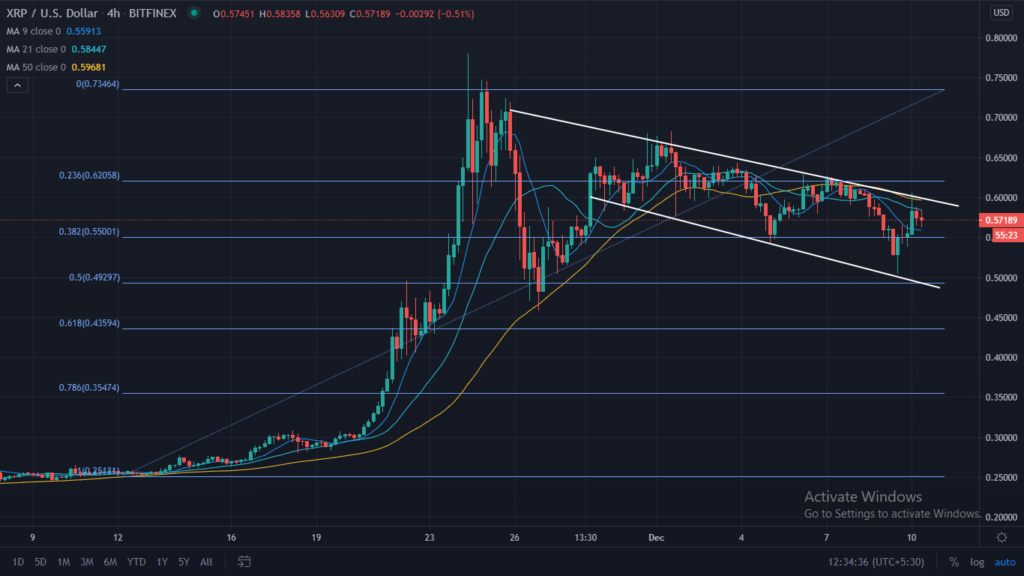
XRP/USD is trading lower on the monthly chart, after making the new 52-Week high of $0.7680 and profit booking pulls it towards lower levels of $0.4600. which can be considered as the support on the downside; however, recovery in the digital asset pushes it upward. Still, XRP is now facing the resistance of falling wedge pattern and 50-Day Moving Average currently trading below 9, 21, and 50- DMA, which is healthy for bullish movement. For bullish momentum, XRP must break its higher resistance line and must be stable above the 50-DMA line. On the higher side resistance is placed at $0.7680 for the short term whereas, for the long term, resistance is at $0.8000. Support on the lower side is placed at $0.4600, and strong support is at $0.3000.

XRP, on the intraday chart after a dip of yesterday’s trading session on 9th December, is trading positive on 10th December with an intraday gain of +5.85% placed at $0.5735. With an intraday volume of $12,411,782,938 and total market capitalization stands at $26,039,062,825. However, on the higher side, it is facing resistance to the falling wedge pattern. Currently, it is sustaining above the 50-DMA line and can be considered positive for the short term. For intraday, it has support on lower levels at $0.5050, and resistance on the higher side is placed at $0.6200.

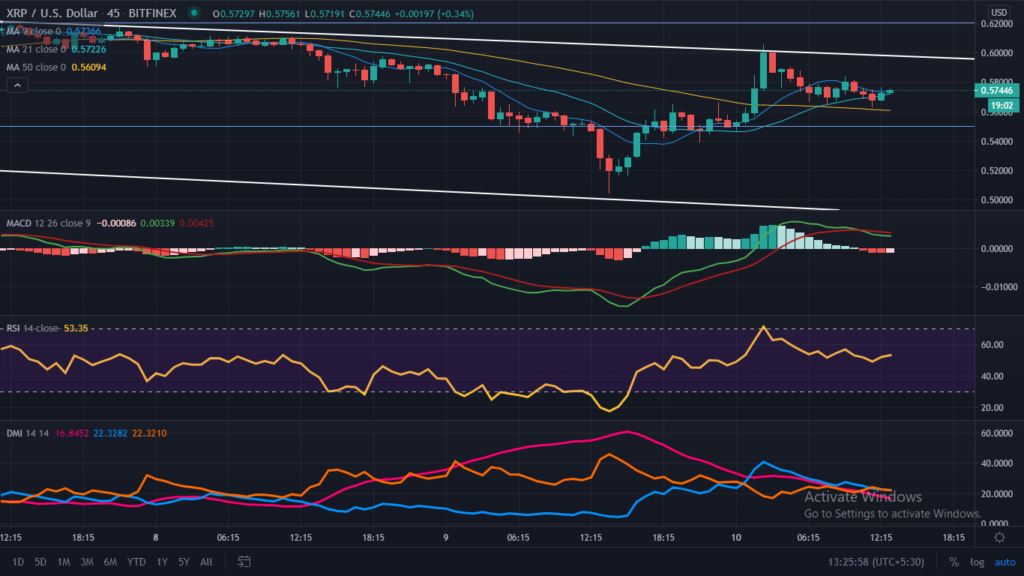
The Relative Strength Index (RSI) indicates the strength of XRP is trading at 56.75 trading flat after testing the oversold zone.
Directional Movement Index (DMI) is trading with a mixed-signal as +DI and -DI not providing a clear signal for the short term.
Moving Average Convergence Divergence (MACD) indicates the trend. Currently, it indicates the bullish trend on the intraday chart as gives a positive crossover with the significance of Bull’s line (blue) over Bear’s line (red) indicating the bullish trend for the short term.
Resistance levels: $0.7680 and $0.8000
Support levels: $0.4600 and $0.300
Join The Coin Republic’s Telegram Channel for more information related to CRYPTOCURRENCY NEWS and predication.
Mr. Pratik chadhokar is an Indian Forex, Cryptocurrencies and Financial Market Advisor and analyst with a background in IT and Financial market Strategist. He specialises in market strategies and technical analysis and has spent over a year as a financial markets contributor and observer. He possesses strong technical analytical skills and is well known for his entertaining and informative analysis of the Financial markets.


