
 Home
Home News
News

- NEM (XEM) jumps over +23% in last 24-hours after the breakout from a double bottom pattern and resistance line
- The pair of XEM/BTC zooms around +16.26% standing at 0.00001334 BTC
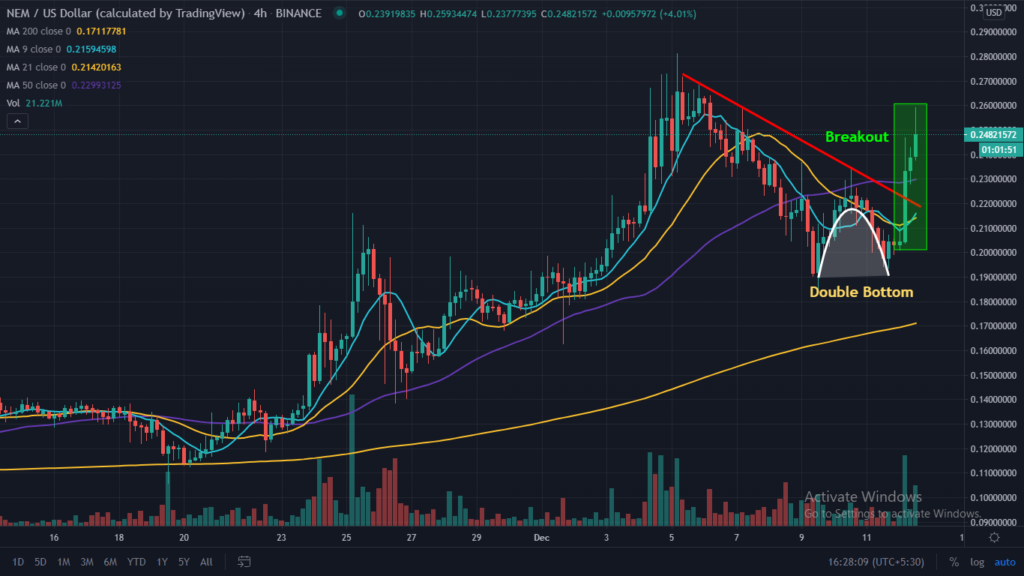
NEM(XEM) gives a positive breakout after clearing the resistance line with confirmation from a double bottom pattern. After a bullish move over the monthly chart and hits a new 52-week high of $0.2790, a profit booking momentum pulls it to the lows of $0.1870 and after testing the level twice it gives a breakout with the great significance of buying volume. Currently, it is trading above 9, 21, 50 and 200-Day Moving Averages indicating the price action stability. The resistance on the higher side is placed at $0.2800, while on the lower side support is placed at $0.1870 and $0.1100 is strong support.

NEM(XEM) on the daily chart is trading with a bullish pattern as gave a positive breakout from the double bottom pattern, currently trading above 9-Day Moving Averages indicating the strength. The CMP is trading at $0.2520 with the intraday gain of +23.29 at the time of writing. Supported by the volume in the last 24-Hours of $186,544,270 and the total market capitalization stands at $2,249,424,340. The support on the lower side is placed at $0.1965, and resistance on the higher side is placed at $0.2610.

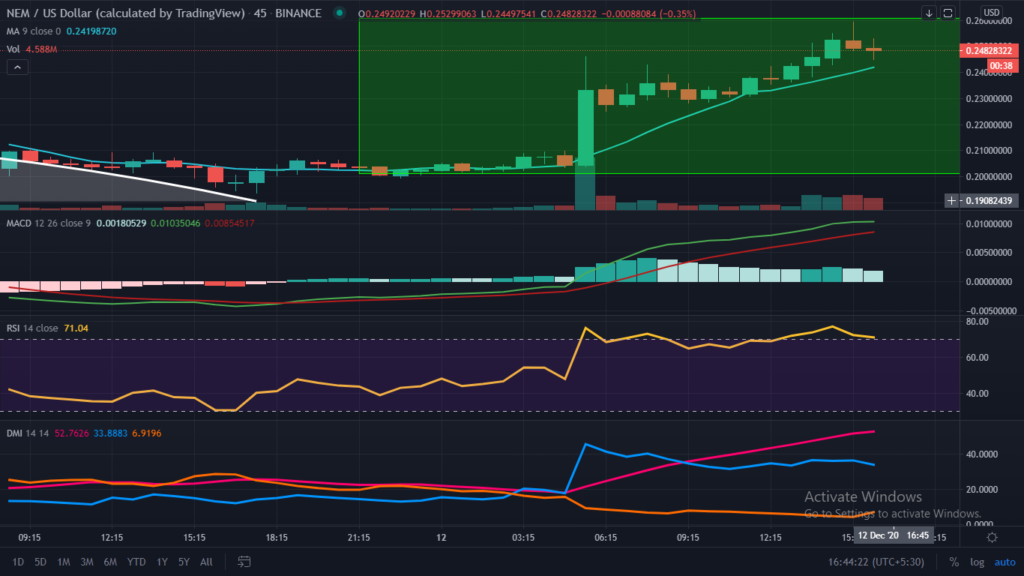
The Relative Strength Index (RSI) indicates the bullish while strength trading at 74.65 and making it to the i overbought zone with minor signs of weakness.
Directional Movement Index (DMI) is trading with the significance of +DI line over -DI line indicating the positive momentum.
Moving Average Convergence Divergence (MACD) indicates the positive trend. Currently, it indicates the bullish trend on the intraday chart as gives a positive crossover with the significance of Bull’s line (blue) over Bear’s line (red) indicating the bullish trend for the short term with no sign of weakness.
Support levels: $0.1870 and $0.1100
Resistance levels: $0.2800
Join The Coin Republic’s Telegram Channel for more information related to CRYPTOCURRENCY NEWS and predication.
Mr. Pratik chadhokar is an Indian Forex, Cryptocurrencies and Financial Market Advisor and analyst with a background in IT and Financial market Strategist. He specialises in market strategies and technical analysis and has spent over a year as a financial markets contributor and observer. He possesses strong technical analytical skills and is well known for his entertaining and informative analysis of the Financial markets.


