
 Home
Home News
News
- OMG’s surged of 27%-28% in the last three days, from trading around $2.5 to LTP $3.46
- In the last 10 days of December it was dormant compared to its past performance.
- Gave a sudden movement in the past 3 days, confirming a breakout on line charts.
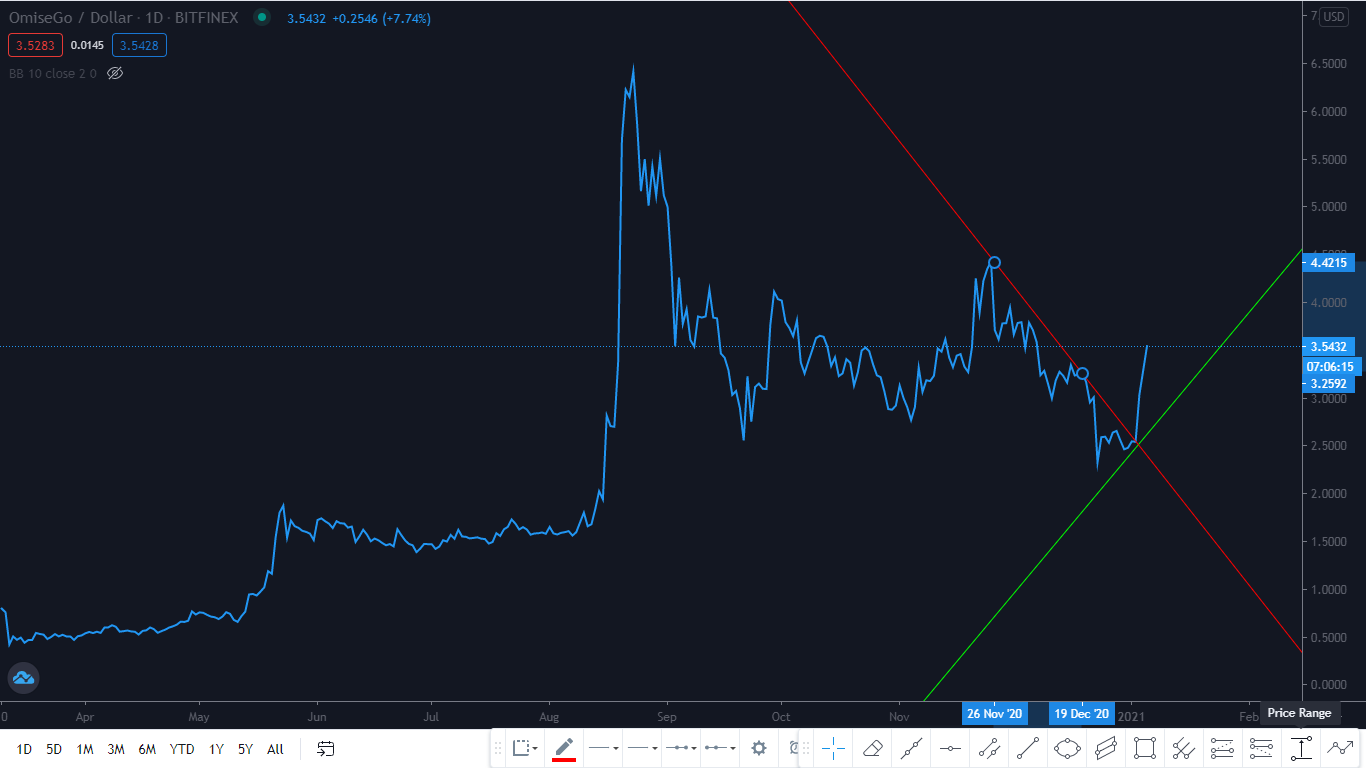

In the last two weeks of December, Omisego showed very low volumes while showing signs of hold in its 5 week long bear run. Its market capitalization is $474,171,237 and 24 hour volume is $686,7145,502. On the line charts, its first resistance was $3, which it successfully broke and is sustaining on the levels at present. Its next resistance is at $3.5-$3.6.

IT MAY NOT BE A SUCCESSFUL BREAKOUT FOR OMISEGO
In order to determine whether it’s a successful breakout or not, we will first have a glance of the price action. It seems that there is no more diagonal resistance on the charts, however we need to be careful of all the horizontal ones which are spotted at $3.40-$3.50 and $3.8 levels.
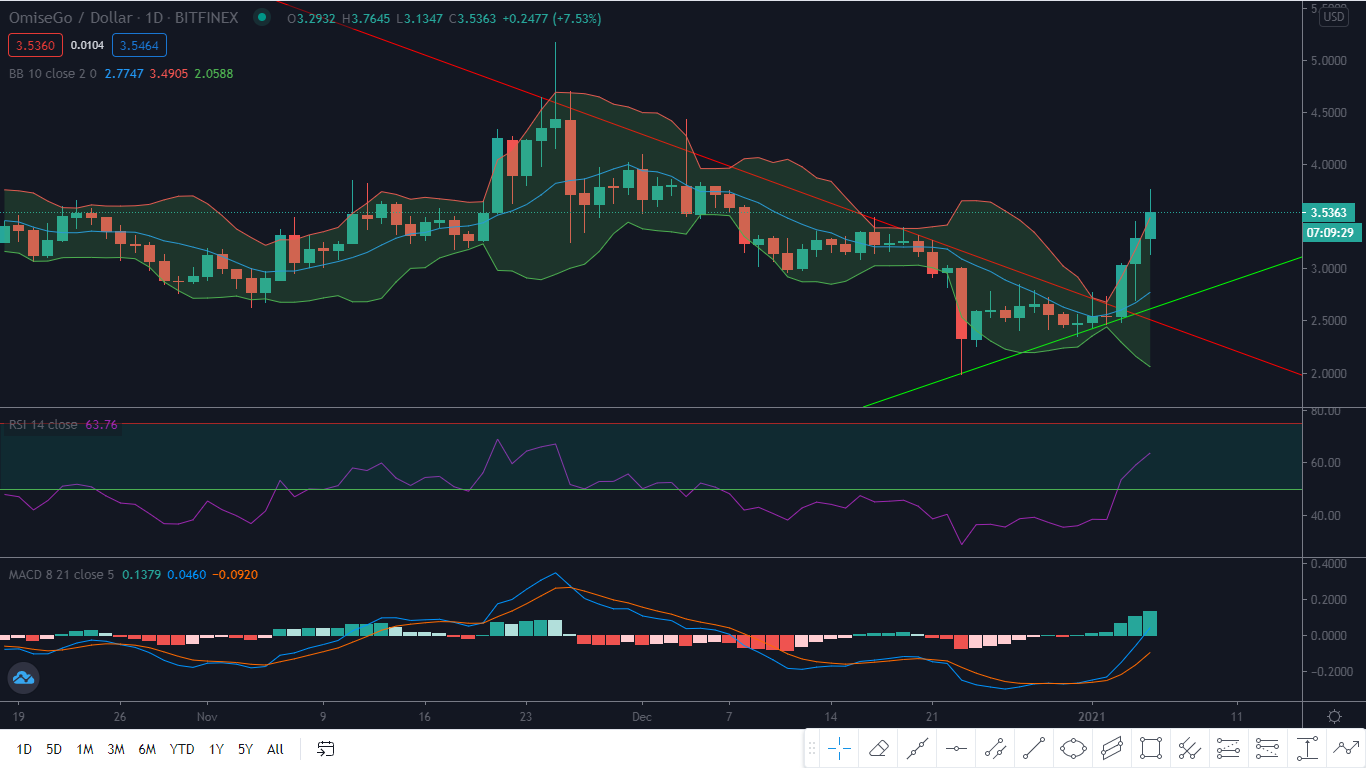
Analysis of the Indicators
The Bollinger Band (10 SMA) has widened up at the time of breakout which is a sign of increase in volatility, especially towards upside. However OMG is currently riding the upper band which is an alarming sign for a potential sideways movement or a breather for the upcoming days. A breather like this expected to retest the support of $3.35-$3.40 and $3.00(if falls further). The median of the indicator is at $2.78 which will be the next support after $3.00.
The MACD (8, 21, 5) also given a bearish crossover, The signal line and slow line are expected to test their upper resistance at 0.00 and 0.3 levels, they are currently at -0.1 levels.
The RSI was around the oversold levels of 30 before the breakout but within 3 days climbed to 63 levels which is actually a resistance for the indicator. If the script sustains $3 level and 60-65 levels on RSI, the script can continue further upward movement.
Supports: $3.375 and $3.00
Resistance: $3.6 and $3.85-$4.00


