
 Home
Home News
News

- MATIC price is trading near its support levels and expects a bounce for the significant targets of $0.04477 & $0.04650
- The pair of MATIC/BTC is trading at 0.00000075 BTC with an intraday gain of +4.11%
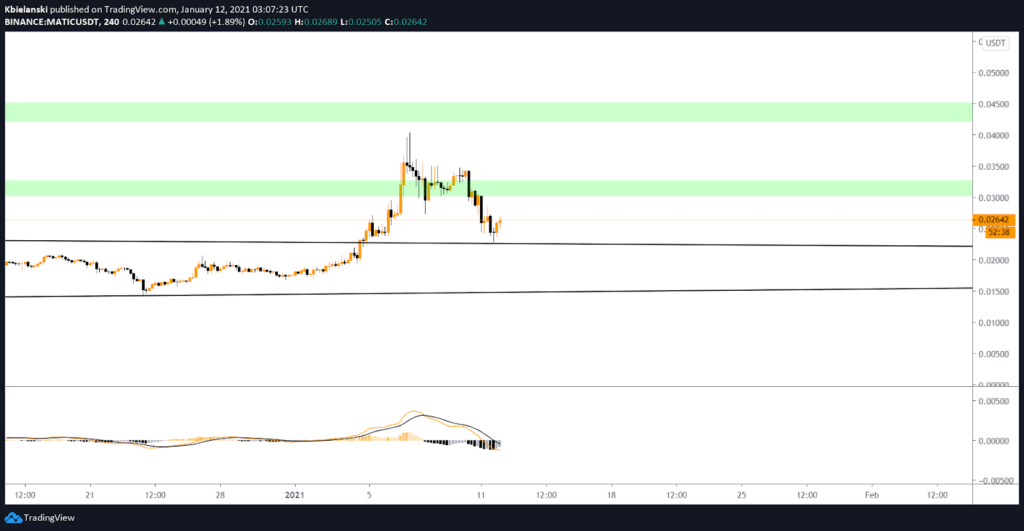
Matic price on the 4-hour was trading near the support line and gave a bounce after testing the support of $0.02309. The coin hits the high of $0.03940 then slips to the lower levels of $0.2209, now trading at the price levels of $0.02699 with intraday loss of -3.72%. The support is placed at the price level of $0.022137 and $0.01475, similarly resistance on the higher side is placed at $0.04000. MATIC on the higher side can test the price levels of $0.04477 and $0.04650. Likewise, the short term target can be considered $0.03132. Currently, it is trading right in the accumulation zone.

Moving Average Convergence Divergence (MACD) currently indicates a bearish trend on the short term chart as it gives a negative crossover. The significance of the selling line (black) over buying signal lines (orange) is high. However, a positive crossover is expected as both lines are heading closer to each other.

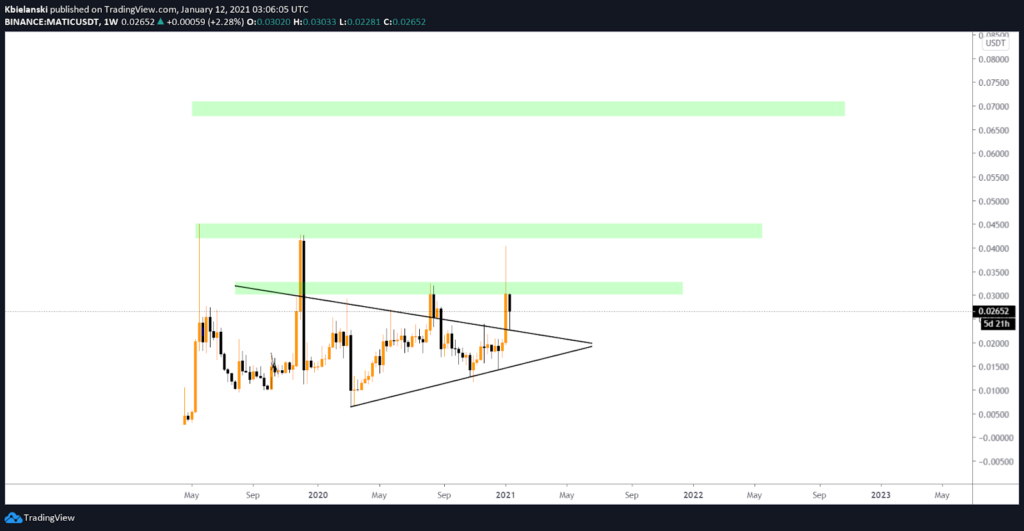
The weekly chart of Matic is trading under the symmetrical triangle pattern and finds the baseline’s support. A breakout is observed over the chart, and the critical support is placed at $0.02137.
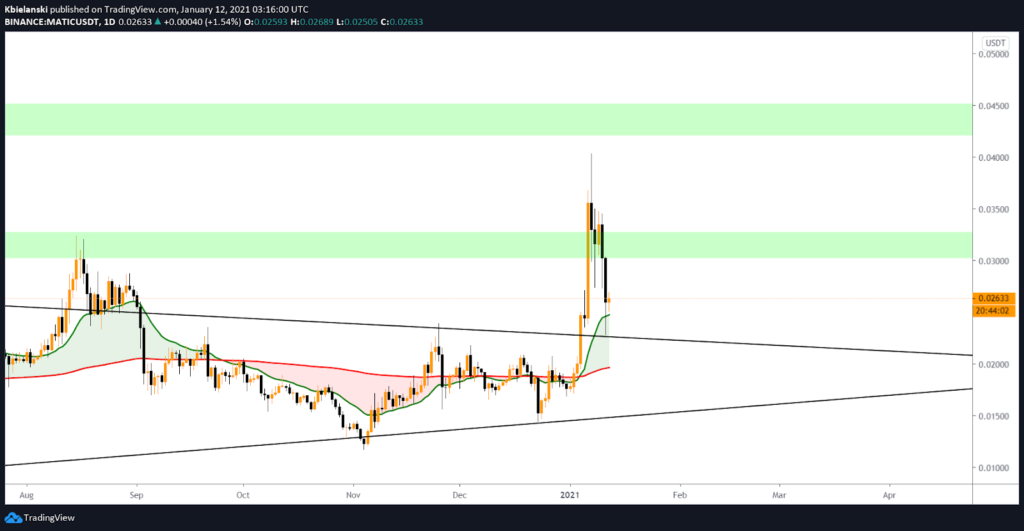
Over the daily chart MATIC price is still holding the 20-EMA and 50-EMA is considered positive after the positive crossover as 20-EMA is trading above 50-EMA.
The Relative Strength Index (RSI) indicates a bullish momentum while trading at 55.26, which is placed near overbought territory. Therefore, it can expect a short-term correction in upcoming trading sessions.
Support levels: $0.02309 and $0.02137
Resistance levels: $0.03940


