- XRP price holds significant support levels of $0.18 and now placed near the critical resistance levels of $0.32 & $0.39
- The pair of XRP/BTC is trading at the level of 0.000008575 BTC with an intraday gain of +4.43%

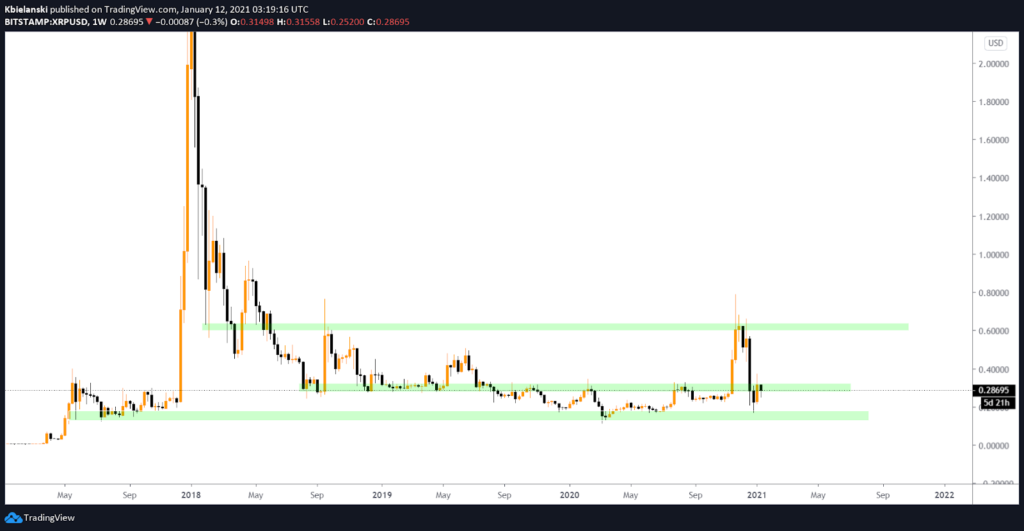
XRP Price on the weekly chart still looks bullish as trading above major support levels of $0.18 and $0.24. XRP after a bullish rally slips from the higher levels of $0.7680 and hits the low of $0.19. The significance buying pulls it above the second key support level of $0.24. However, the coin is still stuck in the range of $0.24 to $0.39 lows and highs. The major support is placed at $0.18 and $0.24.Similarly, resistance on the higher side is placed at $0.39 and $0.44. We can observe a bullish scenario only if the weekly candle closes above the critical level of $0.31.XRP in the last seven days gains over +21.36%.

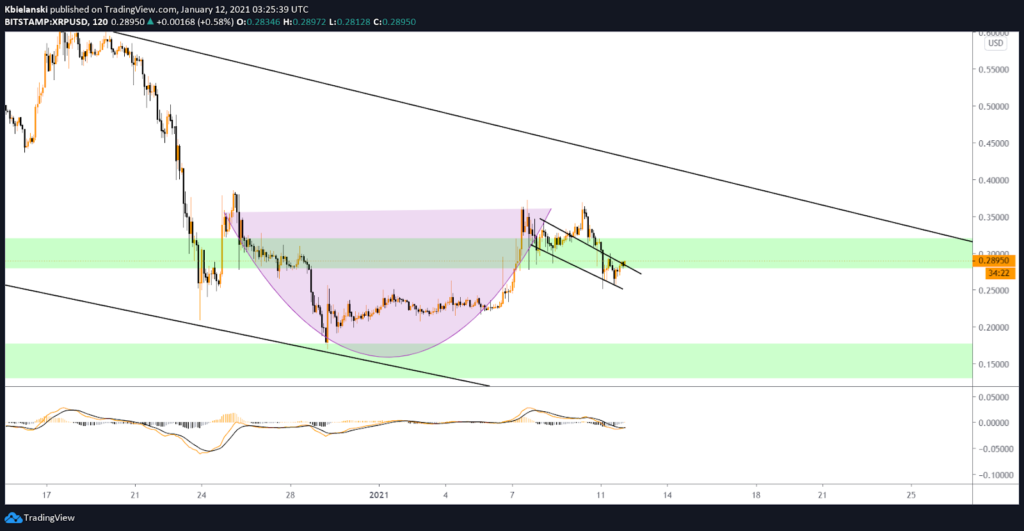
XRP Over the lesser time frame is building up the cup with a handle pattern and looking for the positive breakout only if the hurdle of $0.32 breaks once. On the daily chart, XRP trades at the price level of $0.2865 with an intraday gain of +3.35%. The volume recorded in the last 24-hours is $7,566,485,224, which drops over -20.27%. Likewise, the market capitalizations stand at $12,995,671,562 with a gain of +4.15%.
Moving Average Convergence Divergence (MACD) currently indicates a bearish trend on the daily chart as it gives a negative crossover with the significance selling line (black) over the buying signal line (orange).
Support levels:0.18 and $0.24
Resistance levels: $0.39 and $0.44


 Home
Home News
News


