
 Home
Home News
News
- BSV price is consolidated from a long time, as approaching the vertex of a long term triangle
- A breakout from the triangle may zoom the coin by 18%-54%
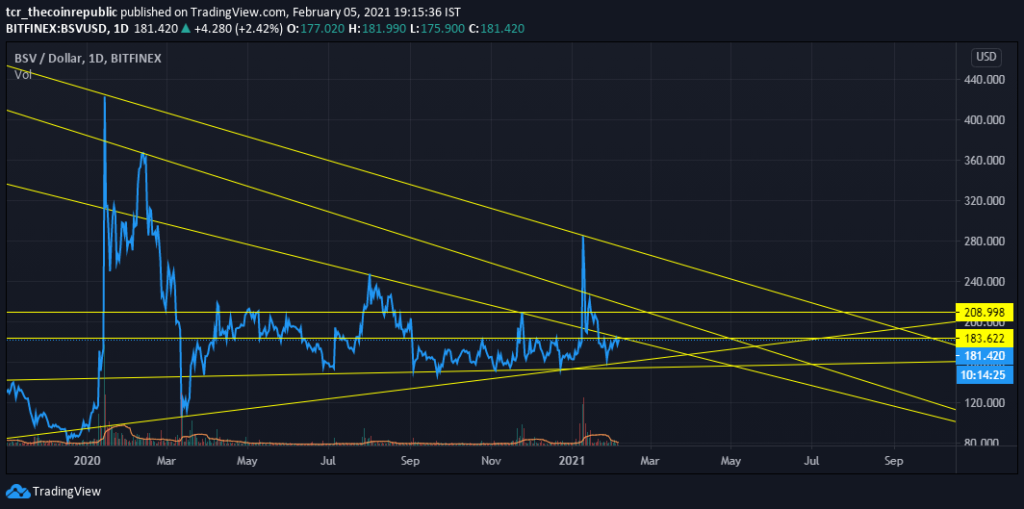
BSV price are making a long term triangle on the daily line chart; It is expected that a breakout from the triangle might surge the coin towards its successive resistance of $209(18% Upside) and $246(36%Upside). The market cap and 24-hour volume are $3,388,861,078 and $125,410,513 respectively.

BSV Price Approaching The Triangle-Vertex, Volatility To Surge Possibly
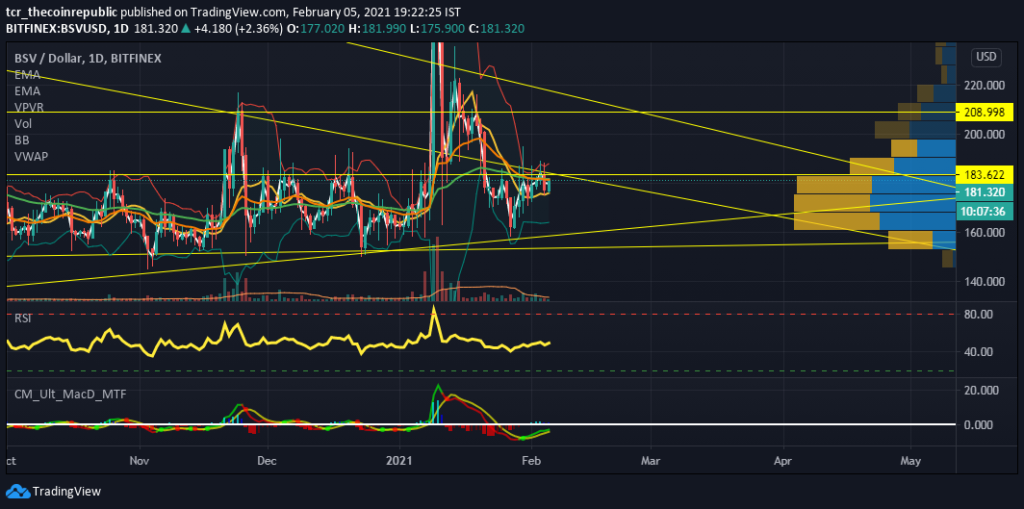
BSV price is consolidated between the resistance and support of the triangle. The price action suggests that the prices are receiving a significant selling pressure at the resistance, verified from the price range volume analysis. The indicator shows an equivalent selling volume against the buying volume, which has made the price to consolidate.

BSV price is currently residing at the 10EMA($176) whereas the 20EMA and 50EMA are supporting the prices at $182. The EMA setup suggests an onset of a possible bull rally; however, it needs to break the resistance first.
The Bollinger Bands are cautiously expanding, which signals a slow rise in the volatility. The upper band acts as a resistance at $188 while the lower band is a support at $164.
The RSI also signals a bull rally as it inclining to cross the 50 levels, while its support rests at 40. 56 and 70-71 are its previous resistance.
The MACD(8,12,5) flashed green for the bulls a few days back in the negative territory, making the bulls to carry the prices from support to the resistance. Now the MACD and price both are at the resistance. If MACD crosses 0 levels, it might bring the coin a bull rally. MACD might face next resistance at 8.33.
Conclusion –
BSV price is testing the resistance at the intersection of long term support and resistance. A breakout might zoom the prices towards targets that are 18%-54% up.
Support: 10EMA($176), 20EMA and 50EMA at $182 and 23.6% Fib level($173)
Resistance: Crucial Horizontal resistances: $185, $208(18% upside) and $246(36%)


