
 Home
Home News
News

- Largest alt-coin Ethereum built on its recent all-time highs on February 5th, 2021 and climbed ever closer to $2000
- The pair of ETH/BTC is trading above all moving averages standing at 0.04307 BTC
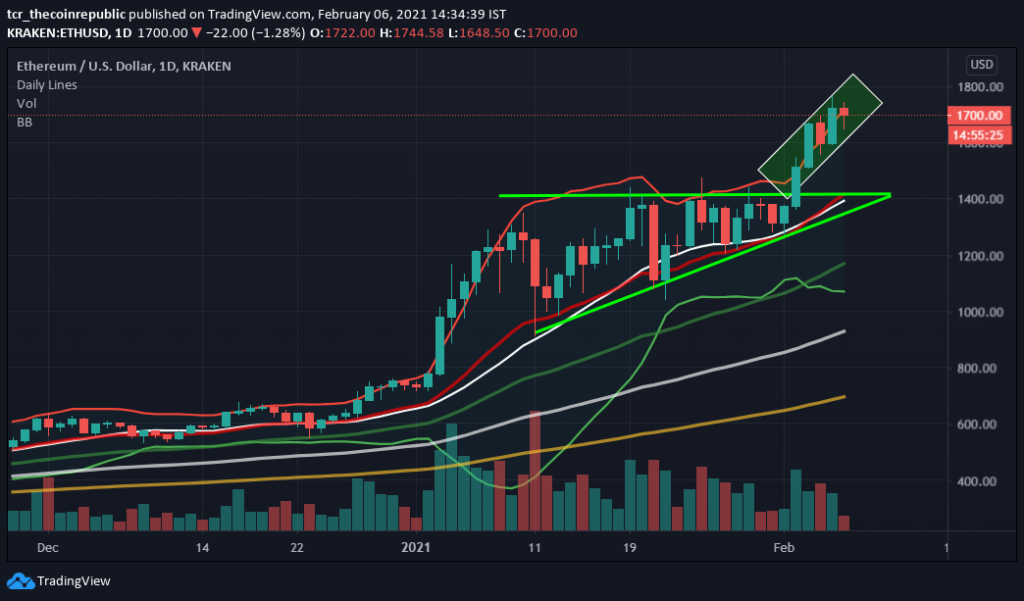
Ethereum (ETH) rally continues after the breakout from the ascending triangle pattern and showcasing a sharp rally, which helps ETH hit its all-time high of $1755. It is presently trading in the upper band of Bollinger Bands (BB) and above all major moving averages of 20,50,100 and 200-Day. Similarly, the 20-DMA ($1420) acts as minor support, while the 200-DMA ($700) acts as strong support on the lower side. However, the volume is not much to support this bullish momentum. The resistance on the higher side can be considered $1780 and $1840. However, a piece of important news which can affect the price of Ethereum in the coming trading session is “Ethereum’s Gas Fees has increased extensively over the years. It has surged over 64% from $14 to $23.27 Gwei from 2020 to 2021″.

Ethereum (ETH) on the daily chart trades with the bullish momentum followed by the rising support line, which indicates its uptrend. However, little profit booking is also observed from the higher levels. Presently ETH is trading at $1680 with an intraday gain of +1.42%. The price is supported by the volume of $47,745,310,181, which has increased over +17.15% in the last 24-hour. The total market capitalization is also increased by +1.95%. Support on lower levels is placed at $1620 and $1400; meanwhile, the higher side’s resistance can be considered $1760 and $1820.

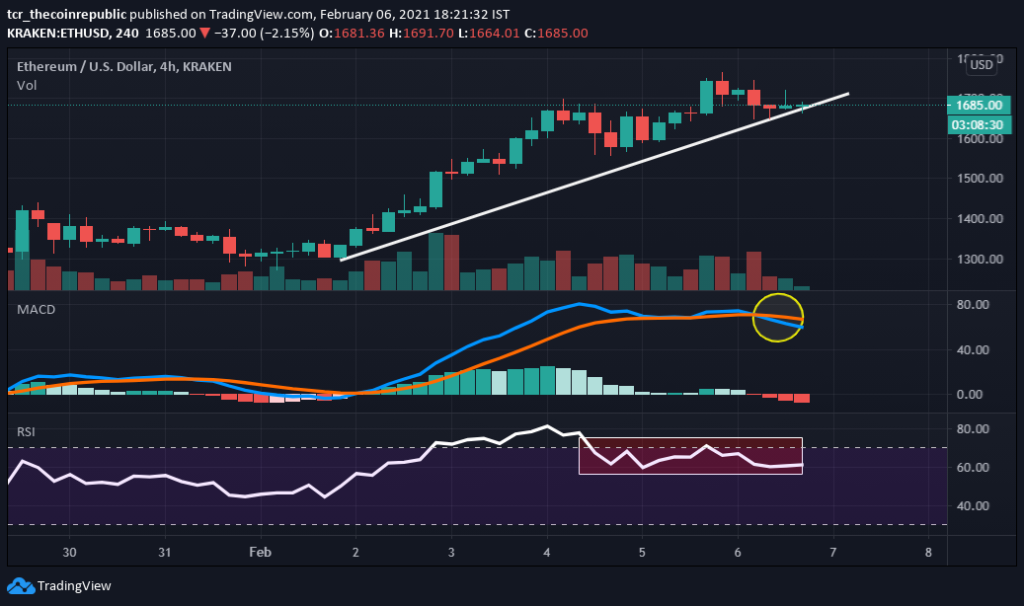
Relative Strength Index (Bearish) indicates a Bearish momentum while trading at 60.06. However, it is currently trading flat near the overbought zone after recovering from lower levels, and some correction is expected as it is placed near the overbought zone.
Moving Average Convergence Divergence (Bearish) currently indicates a bearish trend on the daily chart as giving a negative crossover with the significance of sellers line(red) over buying signal line (green) with no sign of recovery.
Support levels: $1620 and $1400
Resistance levels: $1780 and $1840.
Mr. Pratik chadhokar is an Indian Forex, Cryptocurrencies and Financial Market Advisor and analyst with a background in IT and Financial market Strategist. He specialises in market strategies and technical analysis and has spent over a year as a financial markets contributor and observer. He possesses strong technical analytical skills and is well known for his entertaining and informative analysis of the Financial markets.


