
 Home
Home News
News
- XLM price has risen 27% after the breakout
- XLM price may rise 40% further
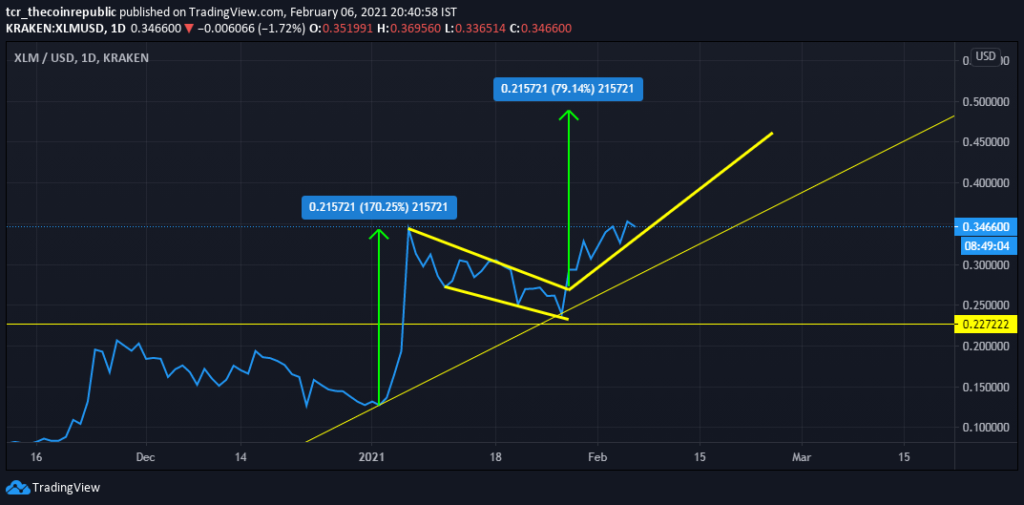
XLM price has given a breakout from the flag pattern and rose 27%. The price seems to be rising further towards $0.5 levels. The market cap and 24-hour volume are currently at $7,693,691,650 and $628,562,288 respectively.

XLM Prices Rising Consistently, Aiming For $0.5
XLM price has taken support along diagonal support which has carried the coin by 27%. The coin is making doji consistently, which suggest gradual participation by the bulls.
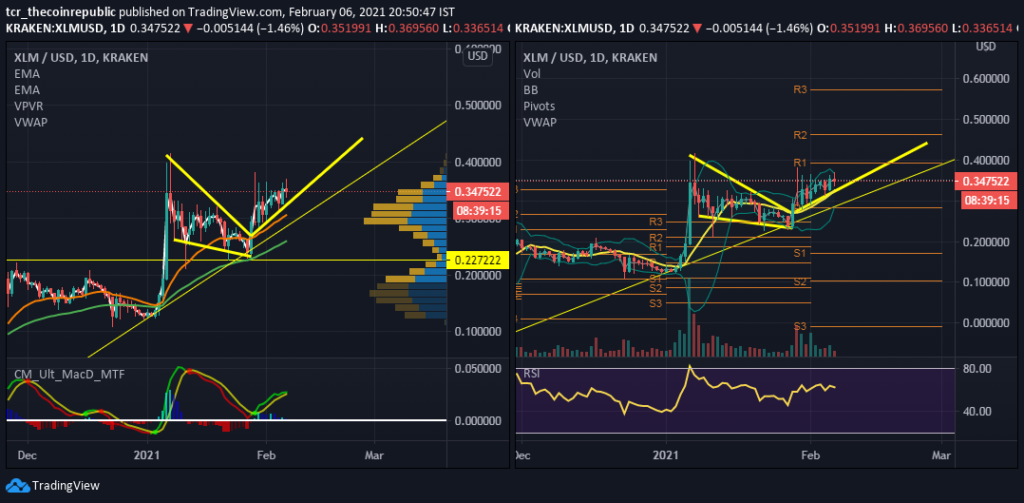
Volume analysis suggests a weaker bull trend, and so does price range price analysis which has a minor excess buying volume over selling volume. The data suggest a minor buying pressure.
The price is also receiving support from 10EMA($0.325), 20EMA($0.30) and 50EMA($0.26). The presence of the price above EMA suggests bullish momentum to persist.
The Bollinger Bands(median 10EMA) are contracting; an indicator of consolidation. The lower band and 10EMA are pushing the price up from $0.28 and $ 0.325 respectively. However, the upper band is restricting the price at $0.366.
The RSI is at 62 levels. The indicator’s support exists at 45-50 levels while the indicator’s resistance exists at 80 levels.
The MACD(8,21,5) indicates a possible reversal as the signal line approaches the slow line and might cross down, triggering a reversal. However, for now, the bull run is to persist.
Conclusion –
XLM price is in a weak bull run which is approaching a crucial resistance of the tip of flag and pole pattern. The indicators also suggest weakness or the possibility of a reversal.
Support: 0EMA($0.325), 20EMA($0.30) and 50EMA($0.26)
Resistance: Upper BB($0.366) and Horizontal Resistance($0.386-$0.4)


