
 Home
Home News
News

- LINK Price has broken out a symmetrical triangle, likely to surge by 13%
- LINK Price needs more volumes to initiate a strong bull rally
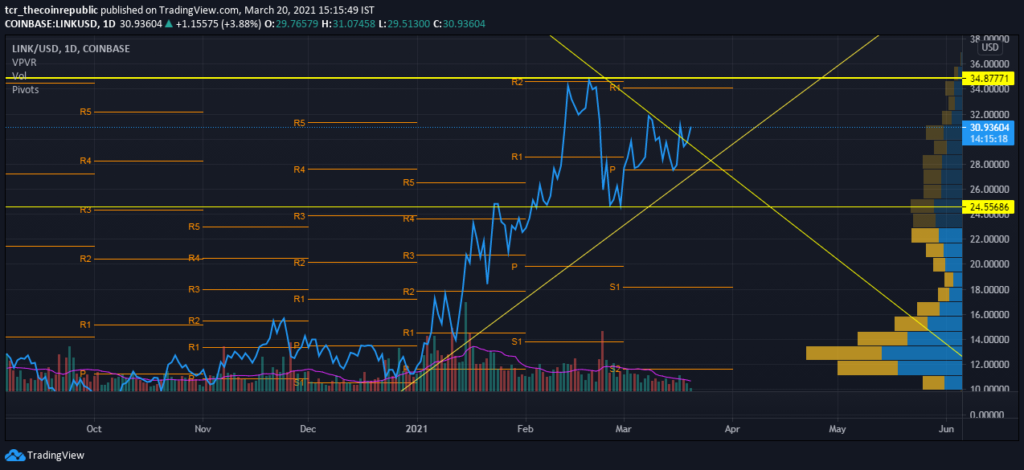
LINK price broke out a symmetrical triangle, made of 3-month old support and few weeks old resistance. The price has risen above the pivot – P at $28 and may test the immediate pivot R-1 at $34. The volume analysis shows a weaker rally so far; higher participation will raise the probability of further rally beyond $34. The price range volumes have a higher buying volume over selling volumes, suggesting optimism among participants. The market cap and 24-hours volume are $12,860,718,963 and $1,156,518,766 respectively.

LINK Price forming a Morning Star Candlestick Pattern
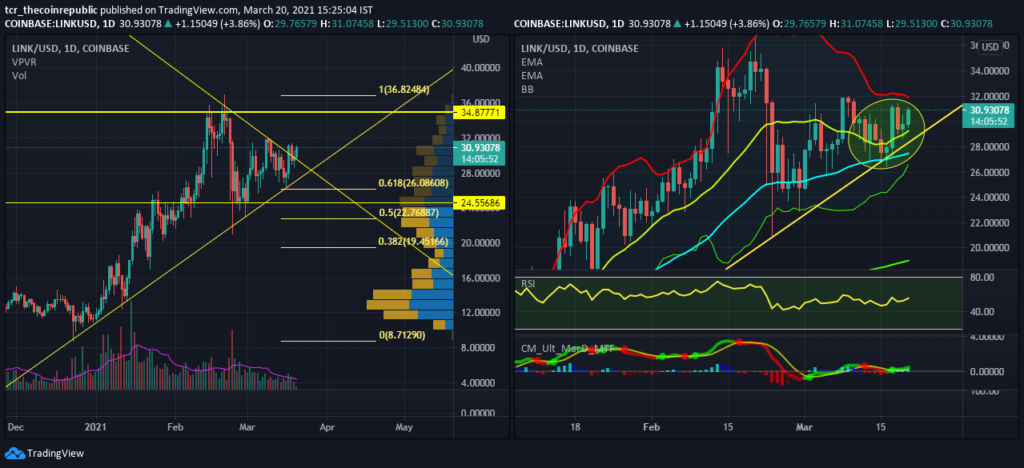
Left Image: Price analysis shows LINK price has taken support from the 61.6% Fibonacci levels, indicating an onset of a strong bull rally from here on. The coin also made a morning star pattern with a bullish engulfing candle which covered losses of four sessions. Immediate support lies at 50% Fibonacci level at $22.76, while immediate resistance is at $36.82(*100% Fibonacci level).

Right Image: The price recently tested the 50-day EMA at $26 levels and confirmed bullish momentum for the coin. The coin receives support from 50-day and 200-Day EMAs at $27.5 and $19.
The price moved above the median of Bollinger brands of 20-period; an indication for the upward rally. The price is taking support at the median. The median and lower bands are at $29.25 and $26.6, which are potential supports, while the upper band is resistant at $31.9.The contraction in bands may hamper the rally. However, such contraction is often followed by considerable volatile movement on either side. Hence a strong rally may commence from here.
The RSI (BULLISH) is at 55 levels; this signals a bullish stance for the coin. Expect the indicator to receive hurdles at 60, 70, and 80 levels.
The MACD(8,21,5) has flashed a buy signal for the bulls by giving a bullish crossover at the 0 levels. But one must wait for the coin to receive further momentum to treat this buy signal as a true one.
Conclusion:
Chainlink’s price has broken out of a symmetrical triangle caused by a retest of 50-day EMA and 61.8% Fibonacci levels. The next Expected resistance is at $34-$36 zones. Momentum oscillators are mildly bullish for the coin, while price action shows a strong bullish rally possible.
Support: $26.08, $22.76 and $19-$20
Resistance: $32 and $34-$36.82


