
 Home
Home News
News

- ZEC price has given a breakout from a symmetrical triangle, which has the potential to push the price by 13%
- ZEC is due on volume to confirm the breakout. However, the price range is dominated by the buyers
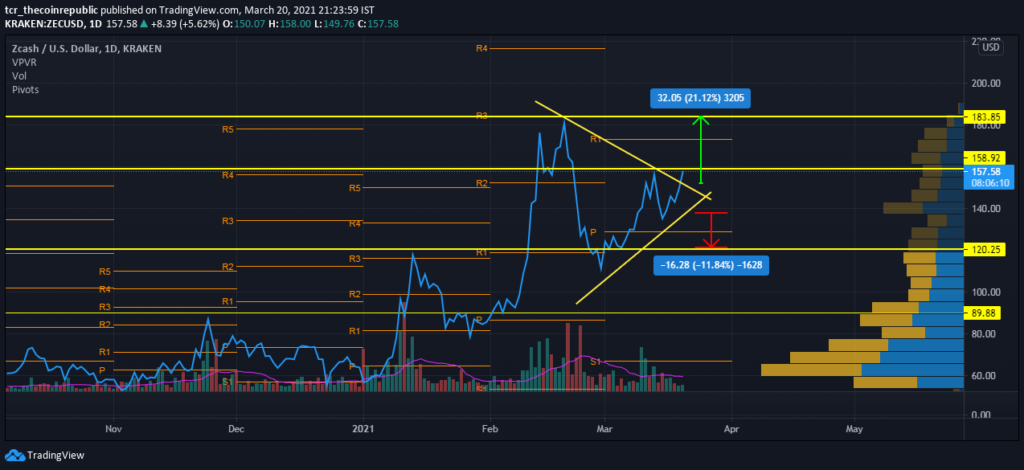
ZEC price broke out of a symmetrical triangle in today’s session, which may take the price up by 13-15% or even more if it breaches its previous top’s horizontal resistance. The price range is crowded with buyers, which shows a formation of a likely support zone; however, the support for today’s session is still low to commence a strong uptrend. The Market cap and 24-hour volumes are $1,771,980,455 and $360,269,253 respectively.

Buckle Up, ZEC price To Take Off!
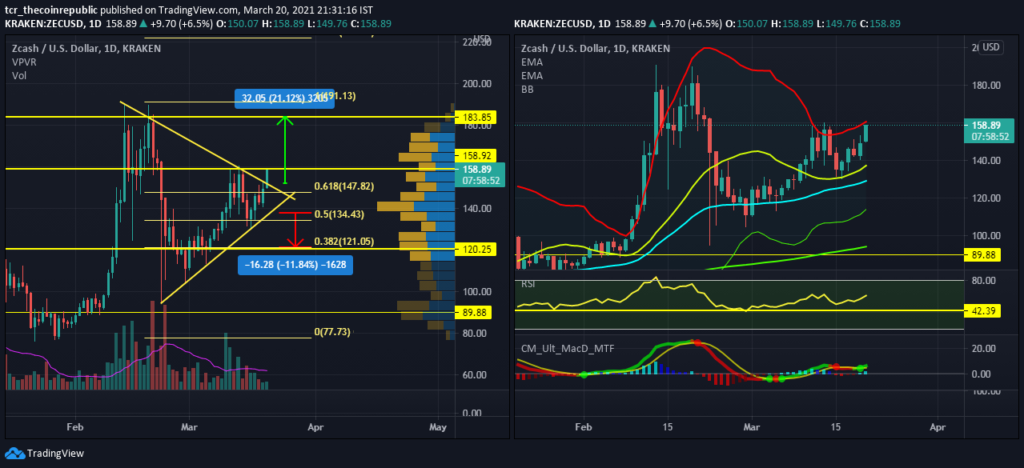
Left Image: Price action of ZEC price shows the formation of a morning star candlestick pattern accompanied by a breach of 61.8% retracement levels. The Fibonacci levels are $121, $134, and $150. The resistance is imposed by 100% retracement at $190-$200.

Right Image: The price has successfully tested the 50-EMA and is continuously rising. The price is supported at $130(50-EMA) and $95(200-EMA).
Bollinger Band shows a confirmation of uptrend as the price, after facing rejection from the upper band, tested the median and continued journey upward. The supports lie at $137(median) and $94(200-EMA).
RSI has reached 60 levels after a breach of 50 levels. RSI above 50 indicates a bullish stance, but 60 levels are resistance for the indicator; a further rally is likely to take the indicator to 80 levels.
MACD(8,21,5) gave a bullish turnover at the 0 levels to signal the bulls for an entry. However, further momentum is still needed.
Conclusion:
ZEC price has taken support at 61.8% retracement and gave a triangle breakout accompanied by a widened up Bollinger band, increasing RSI and rising MACD. Volume is still left to aid the coin to surge further.
Support: $147-$150, $137 and $120
Resistance: $160, $180 and $190-$200


