
 Home
Home News
News
- IOTA price action accumulates on Saturday’s trading session
- The 24-hour volume in IOTA is at $141,434,432 with a 18.51% decrease
- The IOTA/BTC pair was trading at 0.00002599 BTC with a gain of 6.10%
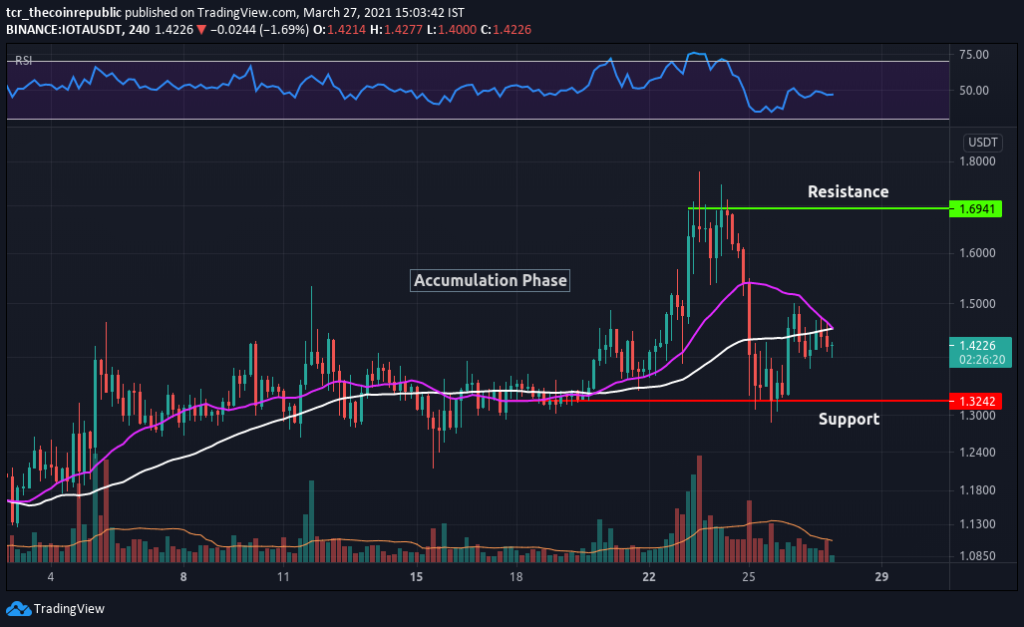
The 4-hour technical chart of IOTA price action forecasts a sideways trend. According to pivot points, IOTA’s critical support level is placed at $1.32. Whereas if it moves up, the key resistance level to watch is $1.69. While diving into the weekly chart of a 4-hour time-frame, it completes an inverted hammer candlestick pattern representing bullish reversal with medium reliability.

SMA-21 & 50 acts as another strong support in the coin. SMA-20 (purple) hits the SMA-50 (white), which projects a bearish trend may happen in future. The price is also below SMA-50 and the price will also follow the negative direction.

RSI indicator (BULLISH), with a value of 47.38, indicates a sell signal in the coin. Moreover, Investors can see a flat slope in the index, and it may plunge in future trading sessions.
The volume of (1.811M) represents a low buying volume which is below the Volume MA (5.795M) of 20-days. High buying pressure is required in IOTA to drive its price to higher levels.
IOTA Price Action Projects Sideways Movement
IOTA price traded at $1.42 with a gain of 3.94% in the last 24-hour and 0.84% down in the weekly time-frame. Furthermore, IOTA bounced back from the support of $1.32. In contrast, the market capitalization stands at $3.97 billion. Technically, investors can perceive a negative crossover in SMA, and the price is below the 50-SMA. RSI index showcases a flat slope. Moreover, the price movement can stay in the accumulation zone for future trading sessions.
Resistance: $1.69
Support: $1.32
Mr, Nikhil Ingole is a Chief Editor at The Coin Republic with over five years of technical analysis & trading experience in Forex and Crypto. As a commerce graduate, he has taken a keen interest in blockchain’s future potentials in the financial industry. A keen cryptocurrency enthusiast, he is very supportive of new media projects, pioneer ideas and the Bitcoin community. He possesses strong technical, analytical skills and is well known for his financial market’s informative analysis. Other than crypto, Nikhil Loves to watch his favorite football team and keep up to date with the latest Formula 1 racing.


