
 Home
Home News
News

- Klaytn coin price fell 35% since April, and the price is still assumed to lose more
- Klay had made an all-time high near $5.1 in March before starting its falls
- The current candlestick pattern formed is aggressively bearish
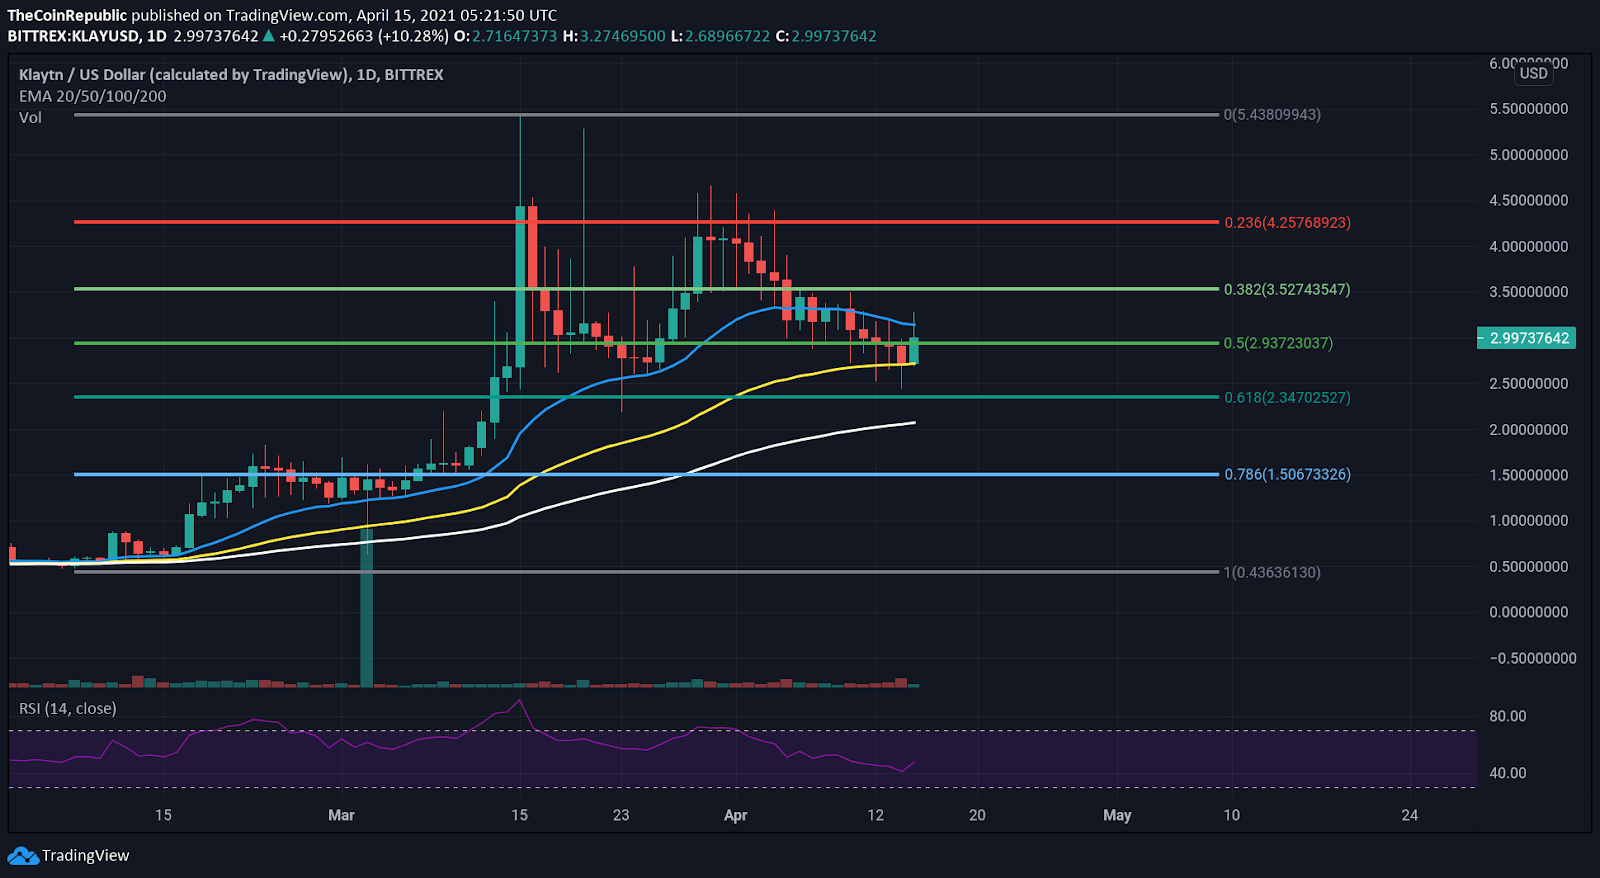

Klay coin had made a round bottom pattern in March, but the price got rejected near the $4.2 level, and the fall prompted to bring the price below the $2.9 level, i.e. the 0.5 Fibonacci level. The fall has been disrupted by 50 ema (yellow) support. However, the fall from here could bring the price below $2.5 or in a worse condition below $2. The 50 EMA is above 100 EMA(white) in the daily timeframe, implying that bulls are still notable. The market capitalization of the KLAYTN coin is $7,227,228,419 (+7.30%) and the 24-hour volume of KLAY is $180,125,211 (+47.44%).

Descent of Klay coin disrupted?
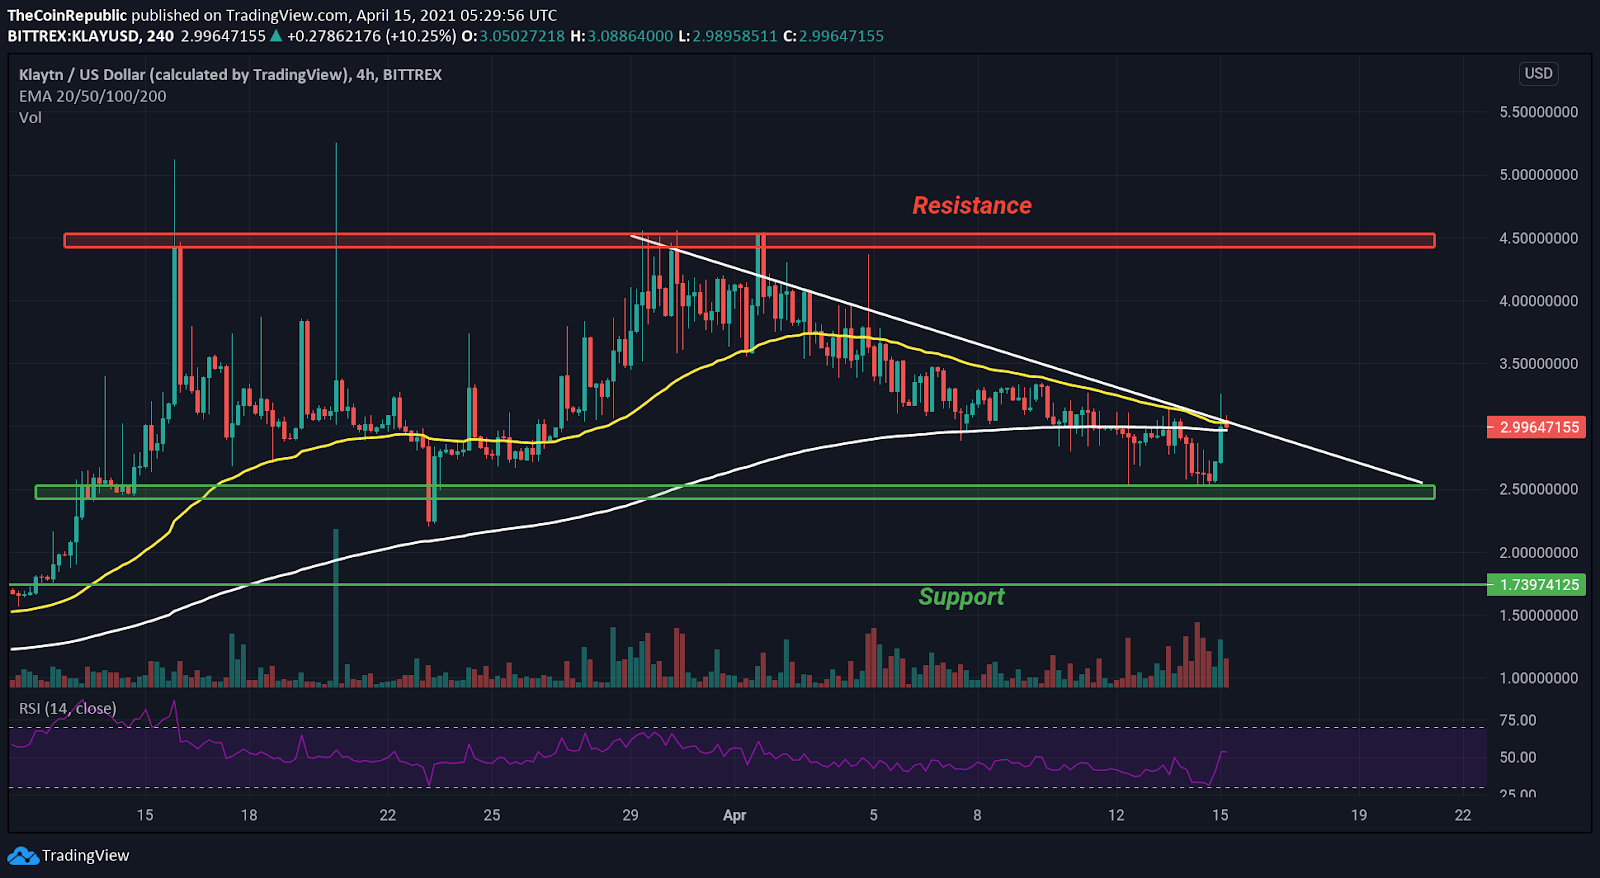
Klay has formed a descending triangle pattern since the end of March, and the support zone marked could turn out to be quite shaky; in that case, the next immediate support level is around $1.80. However, the recently made green candles could have indicated the bulls’ entry, but the long wicks are contrary to this idea.
But if the bulls bring down the resistance trendline, then the next resistance is near $4.50, where the price has got rejected by the aggressive seller thrice.
The 4-hour timeframe of the Klay coin is filled with bearish sentiment as the downtrend has continued for two weeks now. Klay price is below the 50 EMA (yellow), and the 200 EMA (white) and a bearish crossover is on the verge of arising. This crossover could lead to the fallout below mentioned support zone.
The relative strength indicator is spiked in the last few 4-hour candlesticks bringing the value closer in the middle. The RSI could be assumed to be sided along with the bulls.
Conclusion
The fallout of the price from the descending triangle is possible with a higher chance than the possibility of the breakout of the resistance trendline. However, recently made green candlesticks could increase the breakout chance, but one must be cautious till the actual result is known.
Support- $1.79 along with mentioned support zone and 50 EMA (daily timeframe)
Resistance – $4.5


