
 Home
Home News
News

- Sideways movement of Quant is expected to end soon, indicated by RSI
- 50 EMA constantly supports quant coin in the daily timeframe
- Recent Golden crossover in the 4-hour timeframe could be an important trendsetter.
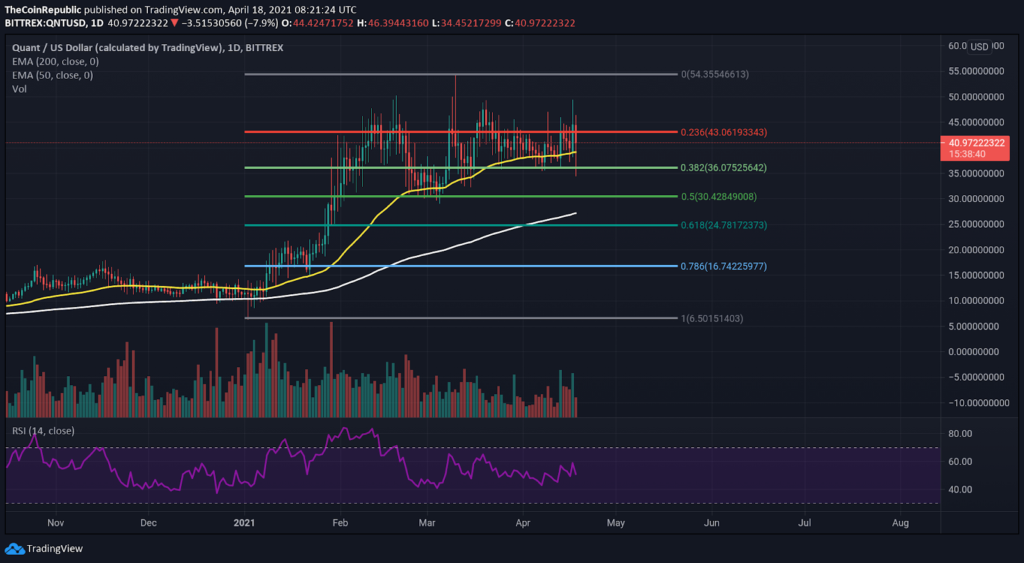
Quant has been in a sideways movement for March, and after experiencing a dip, the QNT price is still inside a range. Quant price is constantly supported by 50 EMA (yellow) in the daily timeframe. 50 EMA is above 200 EMA(white), indicating an uptrend in play. In the daily timeframe, RSI is in the neutral range.

Currently, QNT price is hovering between 0.382 and 0.235 Fibonacci level. The market capitalization of QUANT coin is $473,955,749 (-9.15%) and the 24-hour volume is $18,663,887 (+129%).

BREAKOUT vs. FALLOUT?
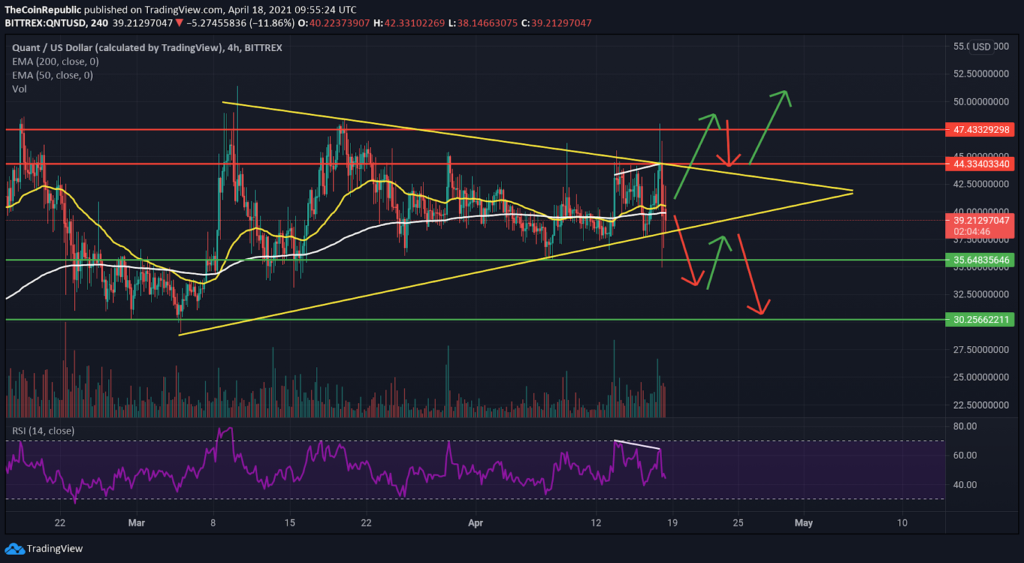
QUANT is between a range from $30 to $47. However, the few indicators are implying a breakout. The price is between $35 and $44 and hovering near $39. The price is in a symmetrical triangle formation, and the price is bottling up in the formation. A breakout could be expected to give an up move of at least 20%, whereas a fallout could lead to prices below the $30 mark. However, $35 and $30 are important to support levels that might disrupt the downtrend.
QNT price is close to 50 (yellow) and 200 (white). EMA implies neutrality in the price. Still, the recent Golden crossover might lead the prices higher and result in a symmetrical triangle breakout.
In contrast to EMA, the relative strength indicator is in divergence from the price pattern, as shown in the chart. Currently, RSI is in the neutral range, close to 50, but the downward slope might lower prices.
Conclusion
Breakout of the symmetrical triangle will decide the further movement of QNT price, and early traders must be careful of fake breakouts as long tails and wicks can put one on the opposite side.
Support – $30, $35
Resistance – $44, $47


