
 Home
Home News
News
- CAKE price on the 4-hour chart discloses the possibility of a bullish crossover between the 20 EMA and the 50 EMA
- The current price of CAKE is $17.72 established on the back of a 4.38% increase in the past 24 hours
- The CAKE/BTC pair is currently trailing at0.000479 BTC with a gain of $4.36% at press time
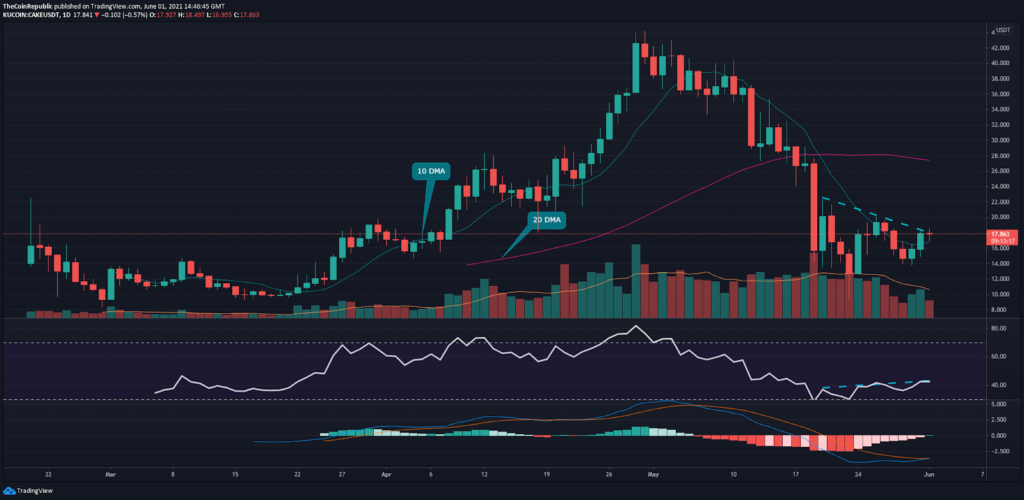
The daily technical chart of PancakeSwap forecasts an indecisive trend on account of a Doji candlestick sitting at a critical resistance level. This proclaims the fact that neither buyers nor sellers were successful in gaining control of the wheel in today’s intraday session.
On the contrary, the Moving Average Convergence Divergence (MACD) has already transpired a bullish crossover. MACD exhibited a bullish cross as such after weeks thus revealing the beginning of a gauging momentum in the upcoming sessions.
The Relative Strength Index (RSI) is gradually making its move inside the equilibrium zone after demonstrating hidden bearish divergence. The absences of new highs on the chart unveil that the bulls are losing strength.
The volume of ($5.20 M) showcases a decline in volume below the volume MA ($8.97 M) of 9 days. While high buying pressure is required for bulls to establish the upper hand, the Crypto Volatility Index (CVIX) has flashed a red signal. This means that Pancake is vulnerable to extreme price fluctuations for the next two weeks. Nevertheless, Pancake is in safe hands as long as the trend sustains above the 10 DMA.
Pancake Price Chart on the 4-hour time frame
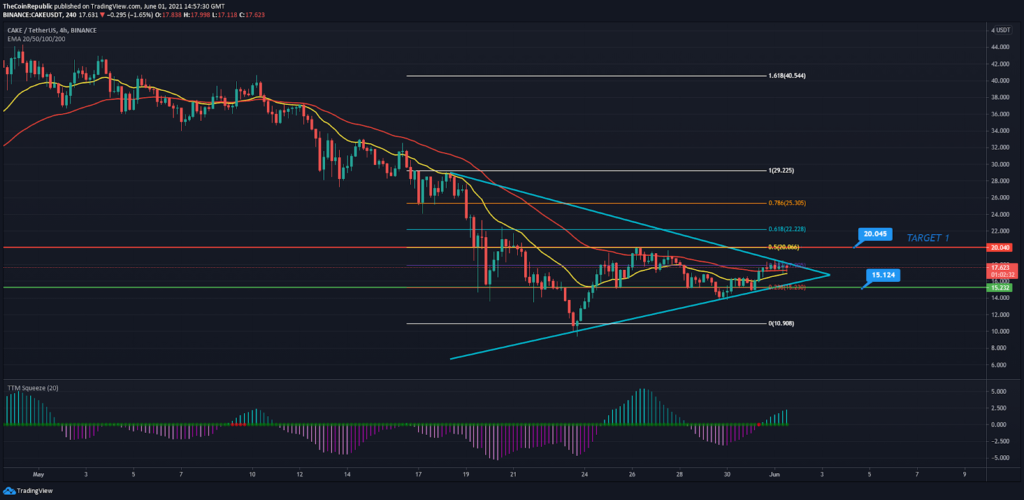
CAKE price action on the 4-hour chart is restricted inside the symmetrical triangle pattern. The current trend of CAKE is hovering in consolidation as a consequence of indecisiveness on the daily chart.
However, a break above the overlying trend line will lay the groundwork for a 12% upswing as mentioned in the title. The above prediction will hold accountability if the 20 EMA(yellow) is successful in transpiring a bullish cross with the 50 EMA (red).
As per Fibonacci Retracements, CAKE is witnessing strong resistance by 17.70 (0.382). This particular level is bolstered by the current price and a rejection from the current price level will most likely plunge the price to revisit the support of $14 (0.236 FIB).
The TTM indicator is displaying strength in momentum as represented by the lengthening of the bars on the histogram.
CONCLUSION: Although the current trend of CAKE is fluctuating inside the range-bound territory, the bullish sentiment remains intact. CAKE has recovered 64% since the fatal drop which indicates that the bulls have prevailed.
A break above the 0.382 FIB will uncover the short-term target of $20. The super trend indicator stands by the buy signal on the 4-hour chart.
Investments in altcoins are subjected to market risks and bitcoin dominance. Investors should conduct their due diligence before investing.
SUPPORT : $15
RESISTANCE : $17.70, $20

Nancy J. Allen is a crypto enthusiast, with a major in macroeconomics and minor in business statistics. She believes that cryptocurrencies inspire people to be their own banks, and step aside from traditional monetary exchange systems. She is also intrigued by blockchain technology and its functioning. She frequently researches, and posts content on the top altcoins, their theoretical working principles and technical price predictions.


