
 Home
Home News
News
- Bitcoin is performing as per the pathway predicted by top analysts
- 280 thousand targets do not seem implausible
- Rekt Capital Supports Melker’s Forecast
The Bitcoin market is in a dynamic phase due to the volatility of its prices. Even after putting all the factors into consideration the outcome is always surprising and different from the prediction. This time however things are a wee bit different.
Bitcoin is performing as per the pathway predicted by top analysts. BTC prices increased on the 4 hour chart and all the parameters are within the predicted limits.
The Wolf of All Streets
Scott Melker also known as ‘The Wolf of All Streets’ gave an interesting prediction based upon his analysis of the monthly chart. BTC breached the EQ line on the monthly chart and from June 2019 to November 2020, the number one crypto coin remained under the line for nearly 17 months.
Bitcoin breached the line in December 2020 and it is tentatively approaching the line for support today. Melker forecast the journey of Bitcoin and where it will go from here.
If BTC touched the upper trend line next month which will be $158,000, a month later it will be 168, 176. In a few months the 230, 250, 280 thousand targets do not seem implausible.
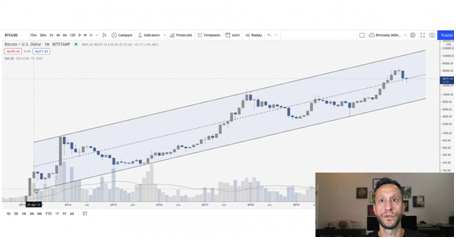
Bitcoin monthly chart | Source: Scott Melker, TradingView
The daily chart reveals that Bitcoin is breaching the midline of the descending channel. BTC has pushed and managed to flip it indo support. Going forward the resistance will be 50 MA or even top of the channel
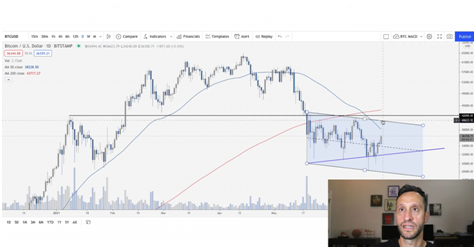
The 4 hour chart reveals a likely Wyckoff accumulation rise. The spring is in place and the $36k level should hold as support. It is the sweep of the lows but such a momentum can surge the value of Bitcoin upto $42000.
Rekt Capital Supports Melker’s Forecast
Popular analyst Rekt Capital also feels that Melker’s Prediction could become true. Tweeting about Bitcoin movement keeping 50 WEMA in mind he added that it could create a potential bull market as well.
Bull Signal from Bitcoin Bottom A Ray Of Hope For Continuation
Bitcoin price tug o war continues and analysts are straining to find a whiff of bullish trend . However the rate keeps grinding against tested support . Till now whenever this happened the support crumbled and a series of liquidations began.
However there are hints of a bullish trend and it is the best hope for the progress to the upside. The light at the end of the tunnel seems real this time because there is a precedent also. The last time Bitcoin gave such a signal it was the bear market bottom and that support eventually held for good. Can it happen again?
Bullish Divergence Similar to Bitcoin Bear Market Bottom
RSI or the Relative Strength Index is an index which measures the strength of an asset compared to price action, and can tell analysts when an asset is oversold or overbought. It is a good tool to deduce if conditions can lead to a reversal, or provide other intel about the price action.
Despite steep selloff BTC has not entered the oversold territory but has found support of a rising trend line that dates back to the bear market bottom. Only once this trend line was touched in the past and it was on Black Thursday
Steve Anderson is an Australian crypto enthusiast. He is a specialist in management and trading for over 5 years. Steve has worked as a crypto trader, he loves learning about decentralisation, understanding the true potential of the blockchain.


