
 Home
Home News
News
- Strong Support by Bulls during death cross in 2019 repeats in 2021
- Bitcoin prices can surge and repeat their performance of 2019
The Bitcoin price correction in present times has got remarkable similarity with similar price action in June-December 2019. The Bitcoin fractal setup from 2019 reveals an interesting possibility compared to the one in June through December 2019. Bitcoin has the potential of reaching $47,500-$50,000.
On June 26, 2019, Bitcoin reached its peak at around $14,000 before turning lower for the rest of the year due to events that were to follow. It included profit-taking sentiment prevalent in the market and a FUD sparked by the Bitcoin Cash hard fork. Still, more trouble followed Facebook’s dispute with regulators over its crypto project Libra.
The Number One Crypto asset tanked to near $6,500 in December 2019. It also caused the 50-day simple moving average (SMA) to flip below its 200-day SMA. The situation is termed a “death cross” by technical chartists. Its formation is a signal for extended sell-offs ahead.
Support by Bulls during death cross
However, Bitcoin bulls held their ground and had values above the 50 weeks SMA. Moreover, Bitcoin’s one-day charts show that repeated efforts by bears to crash the price below the 50 weeks SMA was repeatedly thwarted by the Bulls, who bought every time the value dipped.
The bulls’ action near the 50-week SMA resulted in a powerful upside rebound towards the 61.8% Fib level. However, it represented a dropdown Fibonacci retracement graph, from the $14,000-swing high to approximately the$6,500-swing low.
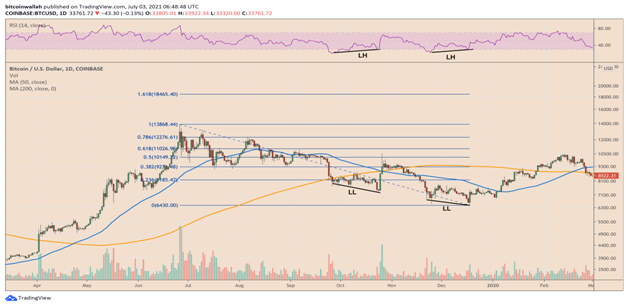
Bitcoin 2019 price action. Source: TradingView.com
The 2019 fractal also revealed two bullish divergence circumstances, where the Bitcoin values reached lower lows and its daily relative strength indicator, a price-momentum oscillator, made lower highs. It hinted weakness in the then existing bearish movement, and the price rose later.
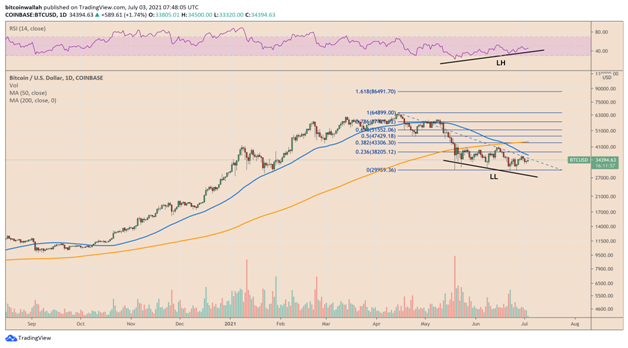
Coming to 2021, the scenario is just akin to 2019 but only halfway. Firstly the cryptocoin went into a price correction phase and its record high of nearly $65,000 landed BTC/USD right at the same 50-week SMA support around $30,000. Again a death cross was formed. The Bitcoin price chart in the last week shows a bullish divergence.
SMA support can send the Bitcoin prices to the 61.8% Fib level
Market analytic platform TradingShot stated that the bullish divergence pattern along with the rebound from the 50-week SMA support could send the Bitcoin prices to the 61.8% Fib level of the current top-to-bottom Fibonacci retracement graph.
A similar Bullish Divergence was also seen in October and late November-early Dec 2019. The divergence precipitated a bounce back to the 0.618 Fibonacci retracement level. The support of 1W MA50 is critical since the level has been achieved despite Bitcoin being on Lower Lows (LL) while the 1D RSI is on Higher Lows (HL)
The TradingShot chart reveals that the 61.8% Fib level appeared near $47,500, and the other chart above showed the profit target near $50,000.
Essentials
The statement is coming when BTC is closing its second quarter at 41% in the red. Bitcoin’s worst performance since its 43% fall it registered in the fourth quarter in 2018. The recent fall of fortunes for the trend-setting cryptocoin can be pinned on several factors.
The last few years have seen an increasing number of nervous nations putting curbs on the rise of cryptocurrencies like Bitcoin. By being a decentralized finance platform working on blockchain technology, cryptocurrencies can bypass many hiccups associated with the traditional and well-entrenched present financial regime. However, nations like China and Turkey have started an all-out war on cryptocurrencies. As a result, global regulators have increased scrutiny, and the latest Joe Biden Government is trying to bring income from cryptocurrencies under the tax net.
The demand for Bitcoin is also falling after the Federal Reserve’s hawkish tone. The Central Bank is concerned by the surging inflation due to uncontrolled dollar printing and could hike its benchmark interest rates by the end of 2023 to curb inflationary pressures. The announcement led to a steep plunge of the BTC/USD rate on June 16 and afterward.
However, Bitcoin managed to stay afloat despite all circumstances and remained above $30,000, a psychological support level and is currently back above $35,000. Nevertheless, the resistance level of $40,000 is keeping the cryptocurrency’s short-term bearish bias intact.
Steve Anderson is an Australian crypto enthusiast. He is a specialist in management and trading for over 5 years. Steve has worked as a crypto trader, he loves learning about decentralisation, understanding the true potential of the blockchain.


