
 Home
Home News
News

Strengthening U.S. Dollar spreads indecision among most traders

- Low exchange volumes and the strengthening U.S. dollar wreak havoc
- Price correction has caused considerable damage to the bullish market
- Long term rise of Bitcoin remains intact
Bitcoin price is still in a state of limbo and fails to gain momentum. Bitcoin is stuck with historically low spot volumes while a strengthening U.S. Dollar spreads indecision among most traders.

Most investors in the cryptocurrency ecosystem are in a state of indecision. Bitcoin is not showing any movement in any direction, which has led to a difficult waiting period for most investors. As a result, the signals are missed and the indicators ambiguous, and the investors are left guessing.
A fresh report from Delphi Digital takes a macro look at Bitcoin’s current price action. The report revealed several causes that had brought the affairs to such a state. It includes low exchange volumes and the strengthening U.S. dollar, which has wreaked havoc on the prices of the number one crypto coin.

Bitcoin’s recent slide to $31,000 has sent jitters down the spine of investors. The possibility of BTC values falling below 31000 could see BTC cooling its heels in the $29,000 to $24,000 zone. The crypto market is already in an aura of fear of this possibility.
The short-term price run of Bitcoin could be impacted by three areas of focus of Delphi Digital.
Spot volumes and open interest collapse
Delphi Digital claims that declining trading activity is one of the prominent factors which are affecting the market. After the May 19 selloff, a migration of spot and derivatives traders from exchanges had started.

The chart above reveals that there has been a significant increase during the first half of 2021. After a substantial rise, exchange volumes have tanked by more than 60% as the prices collapsed and traders swore off using leverage.
The steep tanking of values of BTC also helped to mellow down retail trader’s employment of high leverage in the derivatives market. It is evidenced by BTC futures open interest dropping back to levels seen since early 2021.
Delphi Digital added that the price correction had caused considerable damage to the bullish market structure, with futures basis near 0% and depressed funding rates for perpetual contracts.
The price correction which happened in May helped to clear out the overleveraged trader. In other words, stronger-handed participants are the ones who are dominating the current open interest levels.
Strong Dollar Dollar means a weak BTC.
Another factor that is playing a spoilsport for Bitcoin prices is the surging values of the Dollar. The Dollar has been in an upward trend since bottoming at 89.53 on May 25.
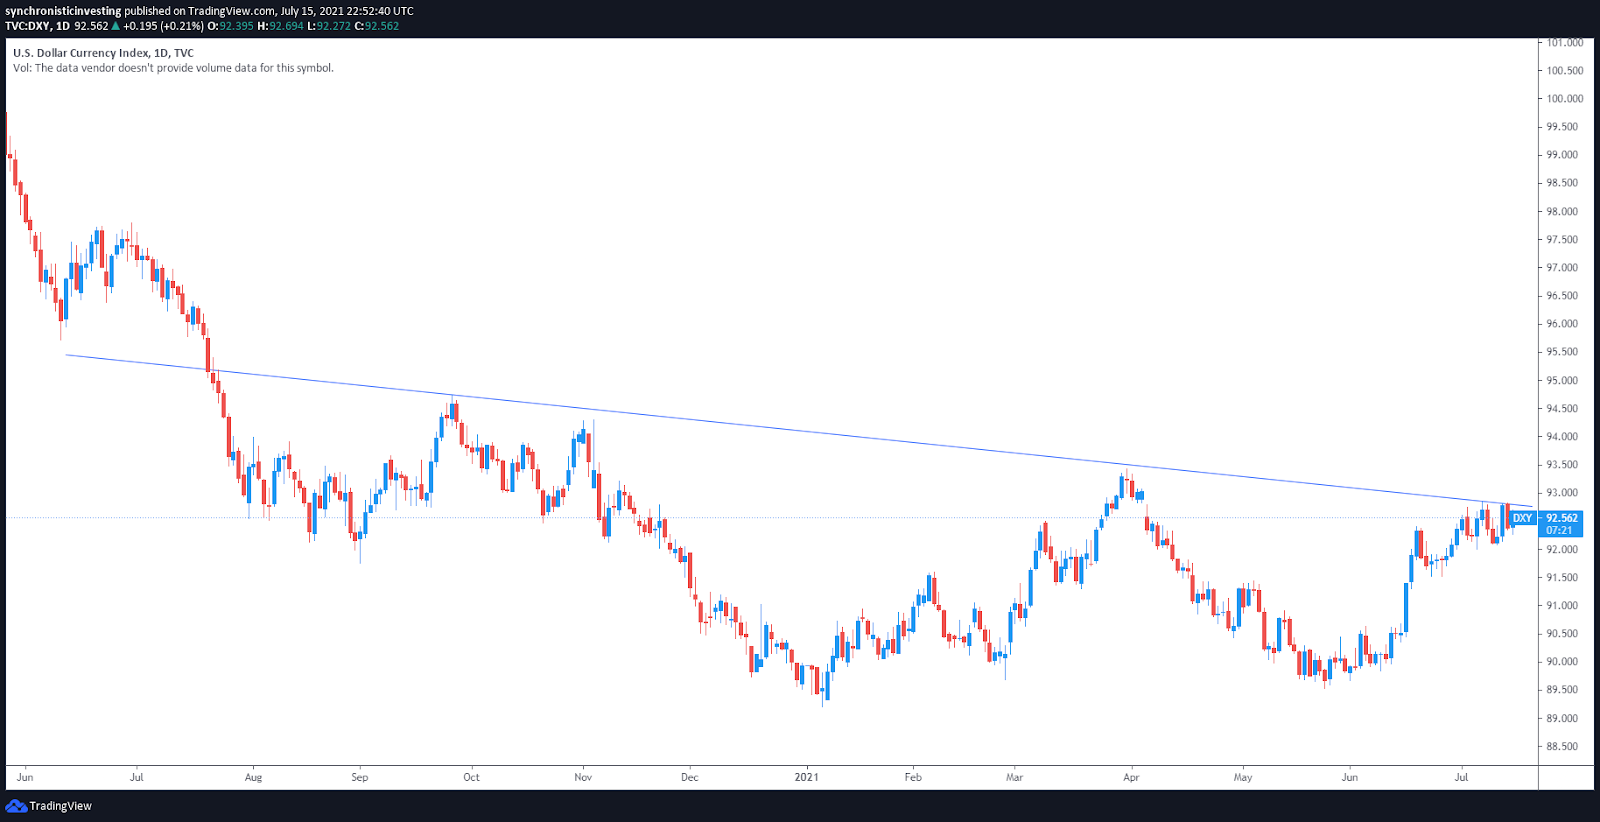
The chart above reveals the large inverse head and shoulders pattern that has formed on the DXY chart. The neckline is now being tested for the third time.
However, if the Dollar keeps rising and makes another leg higher, it will threaten the current economic recovery. As a result, financial conditions will deteriorate, and it might weigh heavily on many of the most popular trades of 2021.
Delphi Digital added a strengthening dollar would hurt Commodities, gold, emerging market equities and Bitcoin. The speed at which the greenback moves will also be a critical factor.
Bitcoin values tank to a long term support
The 51% BTC value drop has left many investors fearing that another multi year bear market is starting. Therefore, it will be prudent to see some of the more significant macro trends that led to the current conditions.

The above chart reveals that BTC had six months of price gain before the price started to crash. Bitcoin was already due for a fallback from a historical point of view. Even if Bitcoin is down by 51% and is now steady on a year-over-year basis, its price is still dizzyingly 250% higher than its $9,100 valuation on July 16, 2020.

The long term rise of Bitcoin remains intact, and its price is currently moving along a 12-month average. Thus, it is a fundamental level of support that will determine where the price heads from here.
Steve Anderson is an Australian crypto enthusiast. He is a specialist in management and trading for over 5 years. Steve has worked as a crypto trader, he loves learning about decentralisation, understanding the true potential of the blockchain.


