
 Home
Home News
News
- The 24 hours trading volume of the token is 362,854,223 and the low of 4.29% was seen. The live price of UNI is $16.79
- The token has shown the pattern of engulfing bearish in the last 24 hours.
- The RSI oscillator for UNI shows the BUY action.
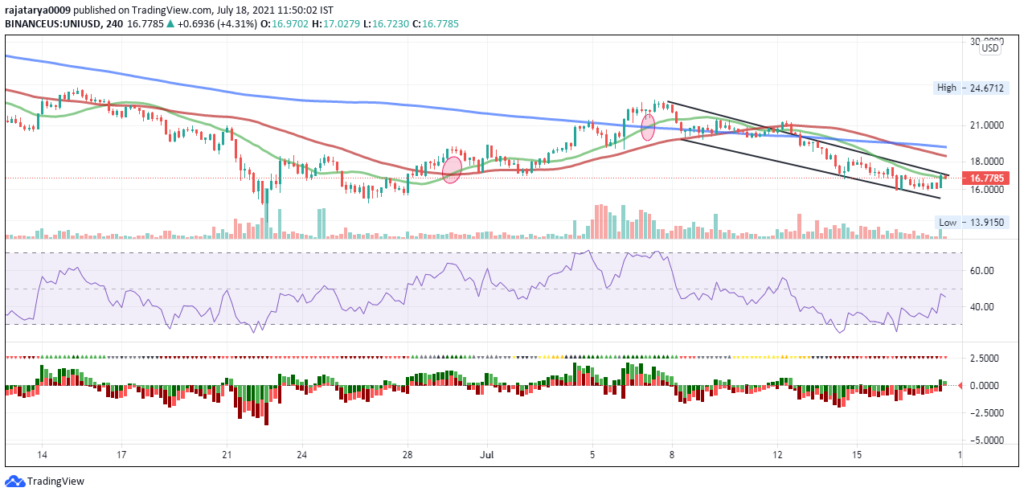
The UNI has been running well below its 200 days moving average and also below its 50 days moving average. The chart above shows the movement of the token with respect to SMA-20, SMA-50 and SMA-200. The token recently trailed above SMA-200 and 50 and has fallen recently. After April, the token crossed its SMA-200 which was marked with a circle in the chart. Another circle is marked showing the token crossed SMA-50. The trendline marked in the chart shows the movement of SMA-20 below SMA-50 and 200 and so the returns are falling but moved approximately to 15-20% when UNI trailed above them.
An RSI oscillator is also present in the chart which shows the proper time to buy or sell the token. RSI for the last 5 hours shows the value of 40.988 and marks the sell action. MA-5, MA-10 shows the buy action whereas MA-20, MA-50 and MA-200 show the sell action. However, the UNI at present is all set to buy as it is expected to cross the SMA-50 zone in the coming time.
The bull/bear power has the value of 0.0160 and shows the buy action. The high/low marks the neutral action with the value of 0.00.
The UNI-BTC pair is trailing at the level of 0.0005255 and the gain of 0.02% was seen whereas the UNI-ETH pair is trailing at the level of 0.008541 and the down by 2.71% was seen in the last 24 hours. The token has shown the percentage gain by 1.32% since yesterday’s open.
The volume/market cap of the token is 0.03681 and its market dominance is 0.77%.
Conclusion: The days range for the coin is 15.9280-17.1680 and presently is at 16.80. The token is expected to show rise in the coming time and if you wish to purchase this token then long it as SMA-20 is below SMA-50 and 200 and soon chances of crossing the 50 and 200 SMA’s can be seen.. If you have already purchased the token then hold it until the rise comes.
Technical Instruments:
Pivot: 16.9207
R-1: 17.0873
R-2: 17.1901
S-1: 16.7541
S-2: 16.6513
(Note- The unit is USD)
Note:
- The unit is USD
- SMA-20: Green colour
- SMA-50: Red colour
- SMA-200: Blue colour

Andrew is a blockchain developer who developed his interest in cryptocurrencies while pursuing his post-graduation major in blockchain development. He is a keen observer of details and shares his passion for writing, along with coding. His backend knowledge about blockchain helps him give a unique perspective to his writing skills, and a reliable craft at explaining the concepts such as blockchain programming, languages and token minting. He also frequently shares technical details and performance indicators of ICOs and IDOs.


