
 Home
Home News
News
- SAND saw bout of purchase in spot markets which came in hopes of a potential collaboration between The Sandbox and Adidas
- The price trends show clear deviations from its relative strength index
- Although the RSI indicators signal bearish divergence, it does not mean that the token’s bullish cycle is over
SAND is the native crypto token of The Sandbox metaverse, which is a blockchain-based NFTs and gaming platform. The tokens inched higher on Tuesday building on its gains made across the month to reach another record high. SAND’s price surged to $5.64 after swelling 16.25% intraday. However, after gains, the price faced corrections to trade near the level of $5.54 at press time. Notably, such performance took the month-to-date and year-to-date gains of the cryptocurrency to nearly 260% and 14,700% respectively. On the other hand, the market capitalization of SAND also surpassed the level of $5 billion ,which positioned the token in the 41st positions, in crypto by market cap.


What helped SAND prices make good gains?
The notable growth of SAND price was in part attributable to the project’s announcement that it will launch a part of its metaverse through its multi-week play-to-earn Alpha event. Indeed, the event is expected to begin from November 29th at 1:00 P.M. UTC. The Sandbox confirmed that it would select a group of 5k players to earn approximately 1k SAND tokens that are currently valued at $5,540, alongwith three Non-Fungible Tokens (NFTs). Only players spending their time across the metaverse’s 18 virtual experiences will be able to claim such rewards.

On the other hand, the recent bout of purchases across SAND spot markets came in hopes of a potential collaboration between the metaverse and sports merchandise giant Adidas. On Tuesday, the sports merchandise giant discussed on social platforms to create a “adiVerse” on The Sandbox. Notably, at the time the tokens saw its price gaining more than 37% against the USD in just 24-hours.
SAND’s upside momentum may hamper
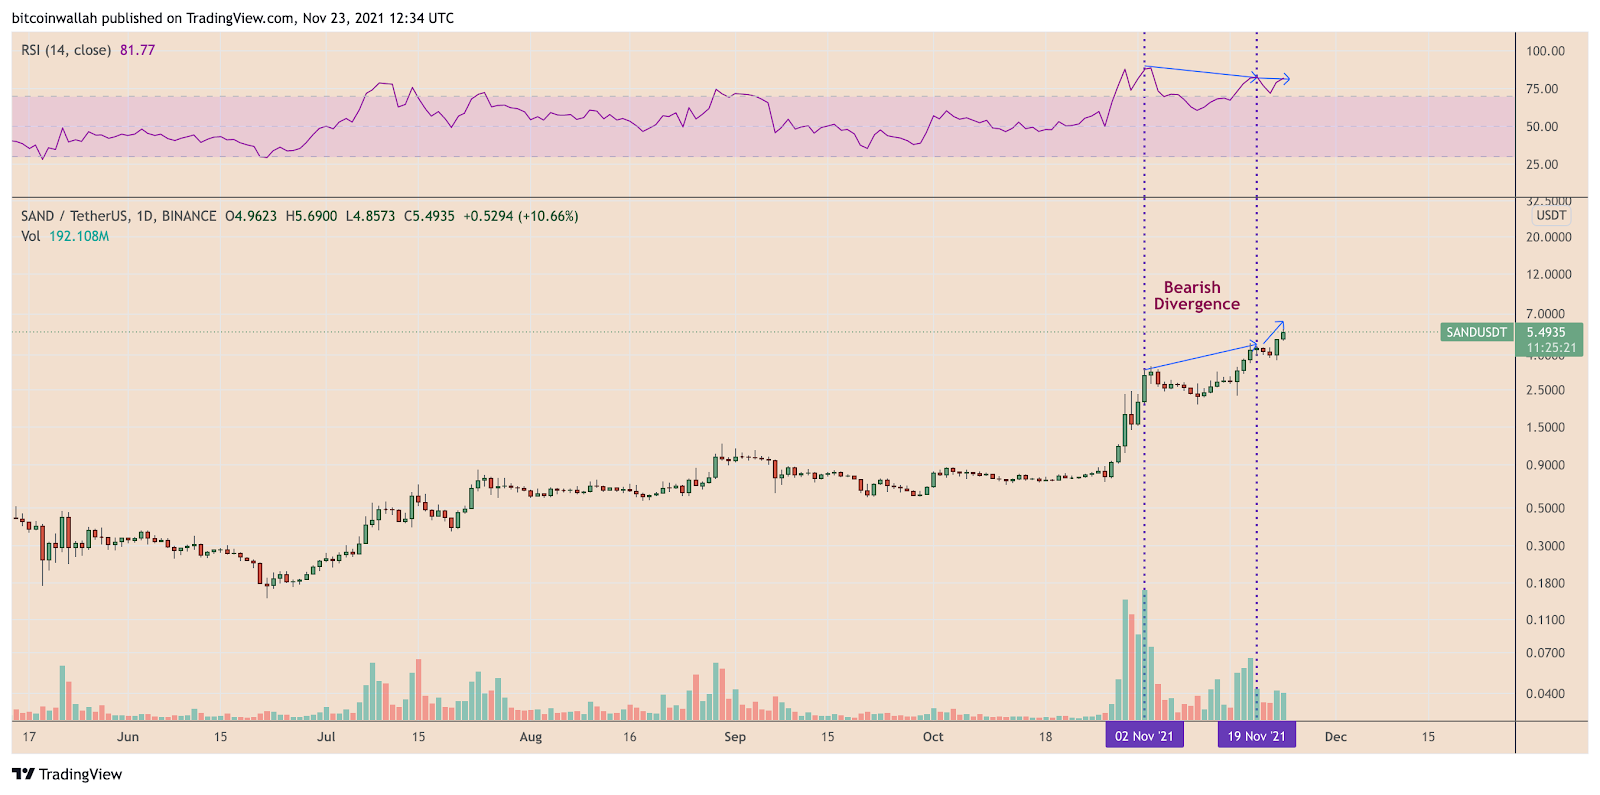
Despite the SAND price having solid fundamentals, it risks rallying into a bull trap. The price trends show clear deviations from its relative strength index (RSI). Hence, there are some bearish signals which may hamper its ongoing upside momentum. The RSI typically returns higher values when the market skyrockets and lower values when it plunges. Occasionally, we have observed that the RSI and the market moves in an opposite direction, that leads to so-called RSI divergences.
According to the indicator and a rising market, there seems to be a bearish divergence. Since the beginning of the month, SAND has been forming a similar RSI divergence which is a sign that the sentiment in the move to the up-side is steadily declining.
SAND’s bullish trend is not over
Although the RSI indicators signal bearish divergence, it does not mean that the token’s bullish cycle is over. However, the performance alerts a possible short-term pullback move. Indeed, the current chart shows the potential entry and exit targets at the level of $0.17 swing low, and $8.72 swing high. Indeed, the targets of the session are based on the Fibonacci retracement graph. In contrast, a continued move over the level of $5.45, accompanied by a surge in volumes may open the possibilities for the token to test $6.70.


