
 Home
Home News
News

- Within the intraday trading sessions, Harmony coin finally broke the tight horizontal range and gained 2.2% of cost.
- At the time of writing, One Coin had broken over the 20 and 50-day moving averages; on the other hand, the 100 and 200 MAs may be seen as a bullish barrier.
- Harmony coin with the Bitcoin pair price seems to be neutral at 0.000005136 satoshis.
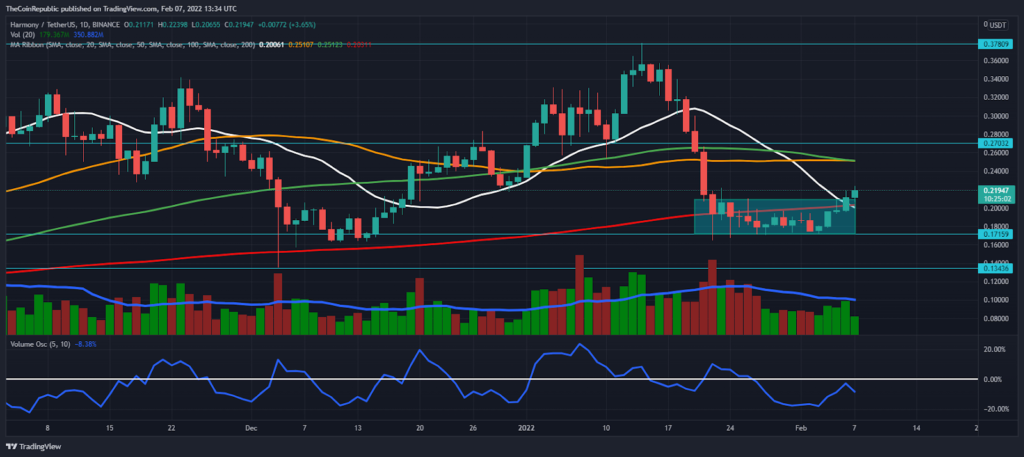
Several days before, The harmony coin was trading sideways near the critical support level ($0.17). As the currency retested the support zone, the bulls had to come to its aid. At the time of writing, bulls had successfully overcome the box pattern (green). On the other hand, the ONE is trading 2.2% higher at $0.2199. The recent resistance may provide short-term support.

The 24-hour trading volume has risen by 22% to $200.8 million. The volume is currently lower than average and must be increased to reach the average volume. The ratio of volume to market capitalization is 0.07855. In terms of the daily price chart, bulls have succeeded in breaking above the 20 and 50-day moving averages. The 100 and 200 MAs, on the other hand, will operate as a bullish barrier. The ONE coin has an immediate support level of $0.17 and a resistance level of $0.27.

Harmony coin’s price approaches crucial resistance at $0.27
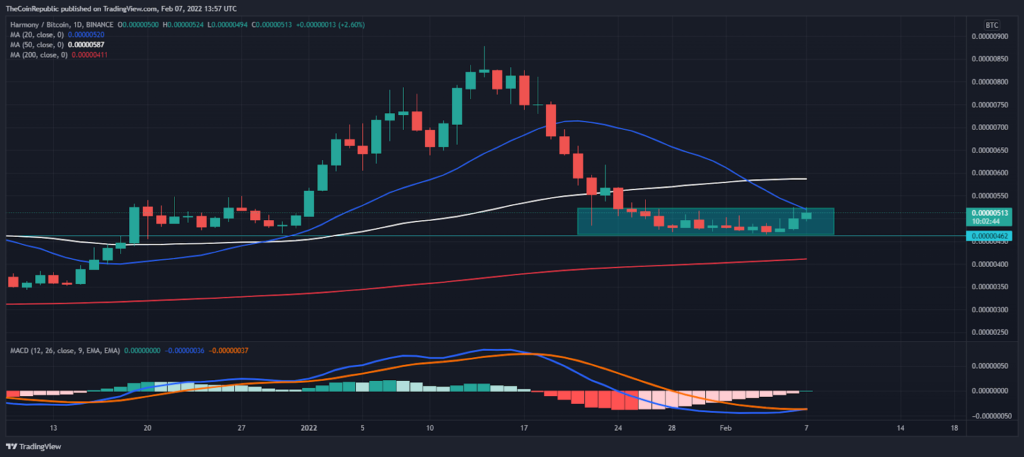
So far, the Harmony coin price with Bitcoin pair has remained in the box pattern. The ONE/BTC, on the other hand, is down 0.98 percent at 0.000005136 satoshis. The 200-day moving average (red) has been below the pair price, but the 20, 50, and 100 MAs have been above it; at the time of writing, the bulls are attempting to keep the pair price above the 100-MA. Furthermore, the MACD indicator is on the verge of producing a bullish crossover from the negative sector.
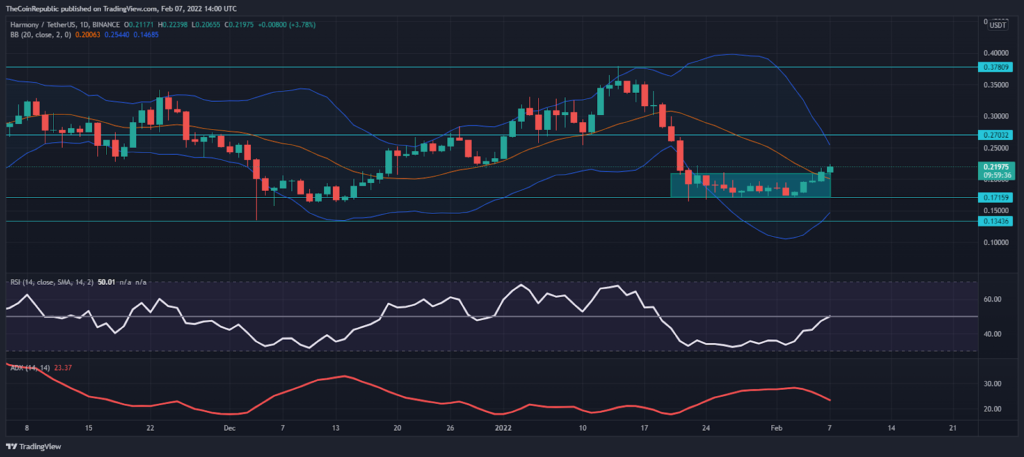
Following its recovery from the lower lever, the price of ONE coin branched the 20-MA of the Bollinger Bands indicator on the daily price chart. By rebounding from the oversold level, the RSI is helping the bulls. The RSI is currently retesting the half-line (50-point), which served as a significant support level in previous trading sessions. The average directional index, on the other hand, sees a lack of bullish momentum.
ALSO READ: Stablecoin Economy Continues to Balloon as USDC’s Market Cap Crosses $50 Billion
Conclusion
The one coin is currently moving with a bullish momentum, and bulls may be able to keep the chart’s harmonious price. The technical indicators also indicate that the Coin is on a sustained upward trend. ONE Coin, on the other hand, has the potential to break out of its sideways trend if bulls can sustain the price above the box channel.
Resistance level- $0.27 and $0.37
Support level- $0.170 and $0.13
Disclaimer
The views and opinions stated by the author, or any people named in this article, are for informational ideas only, and they do not establish the financial, investment, or other advice. Investing in or trading crypto assets comes with a risk of financial loss.

Andrew is a blockchain developer who developed his interest in cryptocurrencies while pursuing his post-graduation major in blockchain development. He is a keen observer of details and shares his passion for writing, along with coding. His backend knowledge about blockchain helps him give a unique perspective to his writing skills, and a reliable craft at explaining the concepts such as blockchain programming, languages and token minting. He also frequently shares technical details and performance indicators of ICOs and IDOs.


