
 Home
Home News
News
Bitcoin needs to attract the crucial attention of investors; they imply low intentions of buying BTC at current levels, BTC and altcoins may face further downside in the future, by this theory.

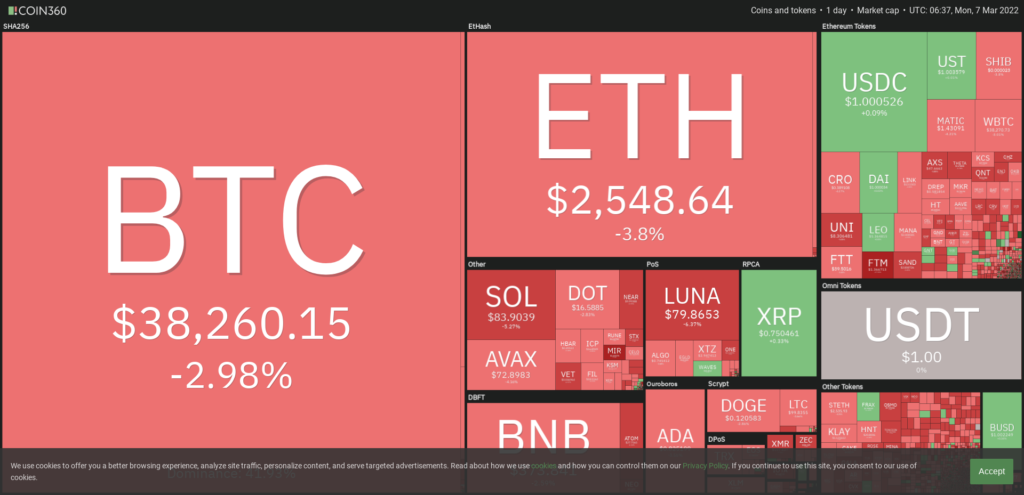
Bitcoin (BTC) tumbled to an intraday low near $37000 today, falling about 50% from its all-time high near $69,000. Bitcoin’s market dominance is still being pulled down due to the ongoing war in Europe.

Bitcoin dropped back below $40,000 at the start of the week amid heightened volatility after the Russian invasion in Ukraine. According to various experts, the ongoing conflict in Ukraine has introduced new and critical volatility to the cryptocurrency and stock markets. Before the recent instability, Bitcoin surpassed $45,000 in February for the first time since early January, when it also fell below $34,000 for the first time in six months.
Investors are worried about Russia’s military operation in Ukraine. For weeks, the threat of Russian military involvement in Ukraine has weighed heavily on global financial markets. The effect of war could be seen in the form of an inflation period on the way to crude and gold prices. The crude oil prices skyrocketed since the war started between Russia and Ukraine. Both cryptocurrency and stock markets may face devastating consequences of war in Europe.
Despite the fact that the long-term story remains intact, the strong bearish fluctuations in Bitcoin in response to any tiny negative news item indicate investor worries. The current bad situation is created by the scenario of war and its outcomes. The negative impacts have started shining all over the commodities. The worries of traders can be seen as the low involvement of intraday traders showcases itself. The trading volume signifies that investors are not getting involved in the trade due to high volatility being experienced as a result of the ongoing war.
Will Bitcoin’s fall devastate the altcoins, or is BTC planning a quick relief rally? Let us see in the below technical analysis of different cryptocurrencies. This technical analysis will tell you about Bitcoin and altcoins’ current outlook in tough days.
BTC/USD Chart Analysis
Bitcoin price broke below the neckline of head and shoulder pattern over the weekly chart. The candlestick formations can be observed below the threshold line, bears could not resist close to the neckline, and weekly candles also signify the low trade and fear of investors at the same time.
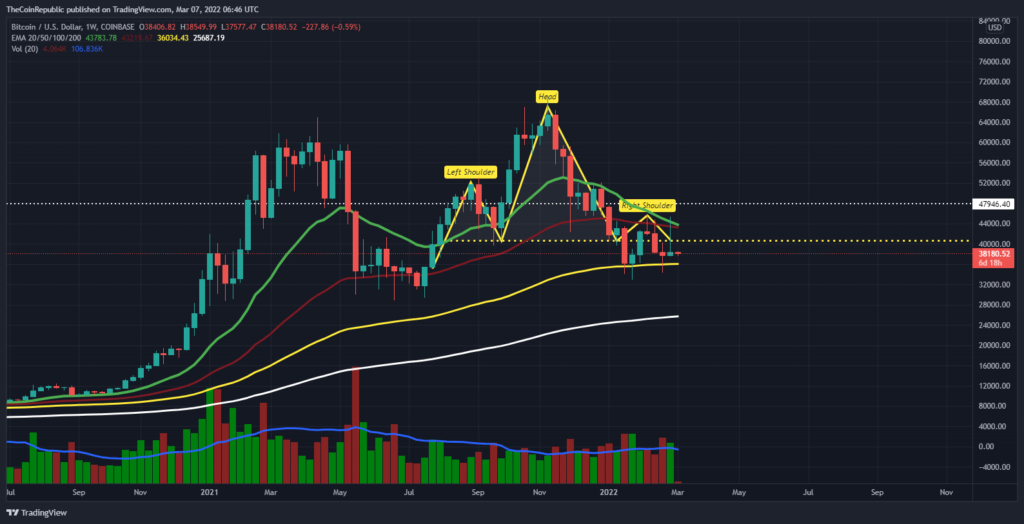
Bitcoin price is presently CMP at $38,160 and has lost up to 3.31% of its market value in the last 24-hour. The trading volume is significantly low for BTC as traders’ intense involvement in the intraday trading session. The investors are worried due to the current war scenario on Russia’s invasion of Ukraine. BTC is trying to recover till the 50 and 20 SMA lines; however, if 20 SMA cut 50 SMA downwards, BTC could witness a slight down surge in its price by the end of the week.
ETH/USD Chart Analysis
The ethereum blockchain has grown to become one of the most extensive networks in the blockchain industry since its inception. Ethereum is at the second position to bitcoin in terms of market capitalization. Ethereum all gears up to introduce phase 2 of Ethereum 2.0. Ethereum is getting ready to release its landmark Ethereum 2.0 upgrade, which would completely redesign the network and address concerns like scalability, high gas fees, and network congestion. However, the delay may cause some trouble as the first phase (phase 0) was launched in December 2020. The crypto miners are still waiting for the bigger and greater upgrades in the upcoming phase (phase 1) in Quarter 2 of 2022. Still, the data is to be announced soon.
Let us look at the current scenario of the Ethereum coin over the charts and its reflex on the ongoing war. The technical analysis will let you know about the price and prediction of the ETH coin.
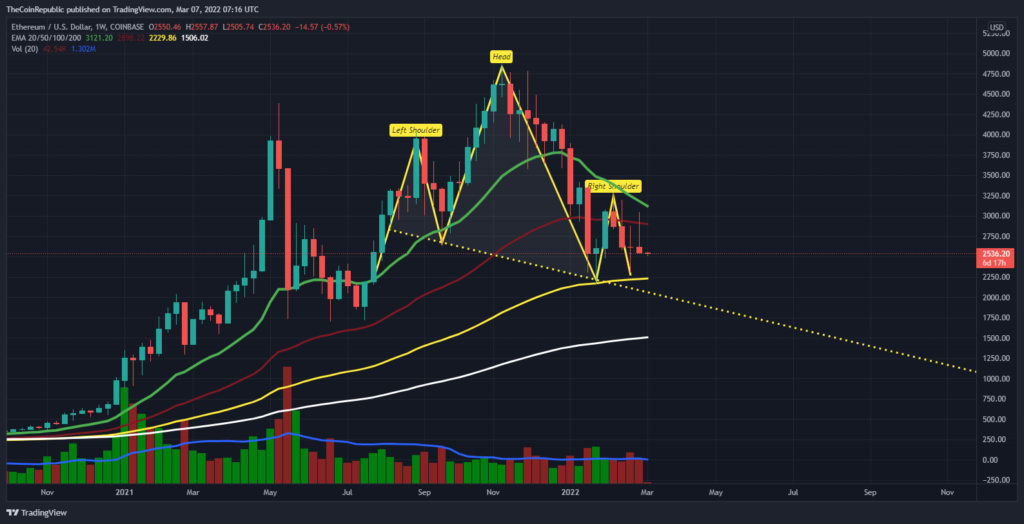
Ethereum Coin price is presently CMP at $2539 and lost up to 3.9% of its market value in the last 24-hour. However, the trading volume is up by 40%, which shows the traders are getting involved. The crypto asset is trading in a head and shoulders pattern over the weekly chart, and looking at the current outlook of the market, Ethereum is also into bearish trap. The ongoing war negatively impacts the whole market. Bears aim to down surge the coin below the neckline, and then only ETH will be able to find the stability.
The smooth trade opportunities led by Ethereum 2.0 will definitely increase the trade for Ethereum cryptocurrency in the near future.
XRP/USD Chart Analysis
You must have heard about the Ripple Lawsuit. In the current scenario of a much bigger problem of war between Russia and Ukraine. You can also recall the long-time battle which has been fought since December 2020 between SEC and Ripple. The shortcomings of war can be seen on the whole crypto market, but Ripple has been facing allegations since 2020. The XRP coin has fallen to the lowest levels and has been trembling since then. Afterward, XRP tried for the recovery, and then a nightmare of downfall again struck at the doorsteps of XRP investors in the form of the Russian invasion in Ukraine, which led the whole crypto market to collapse.
To sum up the positions:
- According to the SEC, Ripple was allegedly selling XRP as an unregistered security. They believe Ripple’s platform is not decentralised because it participates in funding it.
- Ripple believes that the SEC classifies companies based on bias rather than merit (or even well-defined rules). They contend that their operations aren’t significantly different from those of other platforms that have been granted permission.
The technical analysis suggests investors:
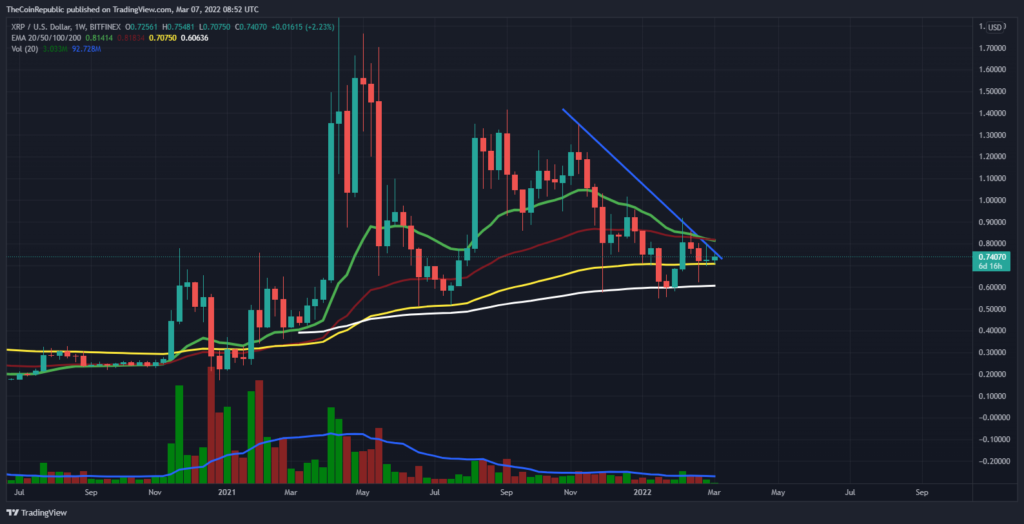
XRP Coin is presently CMP at $0.74 and has lost about 0.94% of its market value in the last 24-hour period. However, the trading volume increases steadily from 7.10% in the intraday trading session. The volume to market cap ratio is 0.06837. XRP coin is trading below a downward sloping line with very low trading volume. The volume change can be seen below average, which signifies the low traders’ involvement. The ongoing war between Russia and Ukraine shattered the whole crypto market. In contrast, the XRP coin is still trading bullish over the weekly chart, indicating some hope to the XRP investors to get involved for the long run.
Terra(LUNA)/USD Chart Analysis
Terra (LUNA) is providing strong hope to its investors. LUNA coin is trading bullish in spite of the ongoing outbreak in the crypto market, giving a strong message about the Terra Ecosystem and its feasibility.
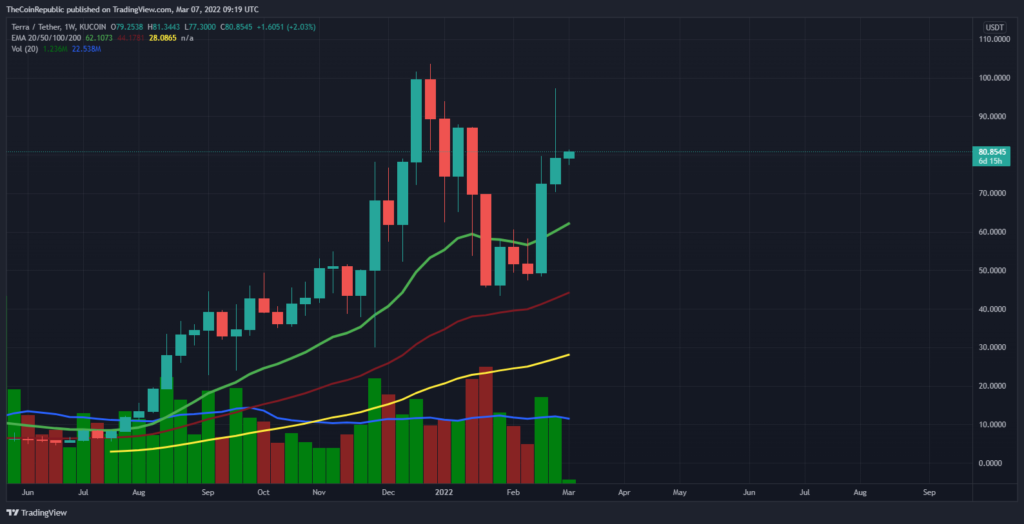
Terra(LUNA) has been trading bullish over the weekly chart. The crypto asset is CMP at $81 on Monday’s trading session. The trading volume indicates investors’ constant centre of attraction towards the LUNA coin. The LUNA coin is trading with strong upward momentum above 20, 50, and 100-days Daily Moving Average. The Terra Ecosystem has tremendous opportunities ahead, and by trading bullish, it’s showing its potential in the stablecoins of the Terra Ecosystem.
Terra has also been named as the biggest competitor of Ethereum in the near future. However, it’s early for Terra to gain this much attention but never too late in the crypto industry.
Also Read: SafeMoon: What Is It Really And What Lies Ahead?
Solana/USD Chart Analysis
Solana is also one of the biggest competitors of Ethereum. Solana is a decentralised crypto computing platform that promises to achieve high transaction speeds while maintaining decentralisation. It uses many innovative techniques, one of them is the “evidence of history” method.
The native cryptocurrency of Solana is SOL, which is utilized for transaction fees and staking. It also allows owners to vote on future upgrades. Like Ethereum, Solana is also a cryptocurrency and a flexible platform to run crypto applications. Covering from Degenerate Apes to the serum decentralised exchange (or DEX).
The price of SOL-the cryptocurrency that helps empower the smart contract- compatible Ethereum’s competitor SOL has been continuously falling since November 2021. The token slipped from the $260 resistance level to the $82 current level.
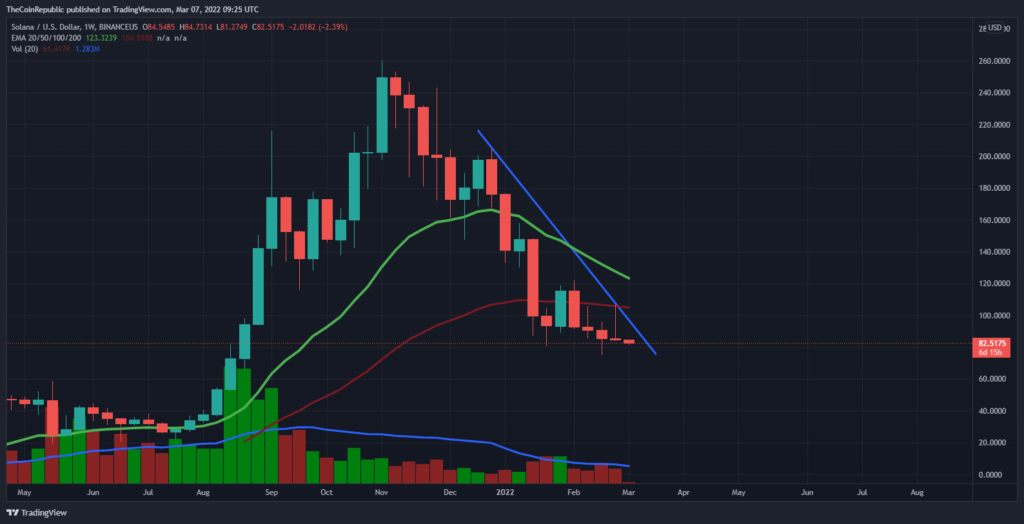
SOL Coin is trading bearish over the weekly chart. Looking upon the market’s current scenario, world tits may continue to fall to the lower level until they arrange their support in the lower levels. The trading volume is below average, which signifies SOL needs to attract more buyers. However, the investors are not putting their hands willingly into the trade because of the shortcomings of the ongoing war in Europe.
Cryptomarket is well known for its highly volatile nature, and investors are well aware of this fact. The crypto market will get to stability as soon as the war stops affecting both the crypto and stock market.
Disclaimer
The views and opinions stated by the author, or any people named in this article, are for informational ideas only, and they do not establish the financial, investment, or other advice. Investing in or trading crypto assets comes with a risk of financial loss.

With a background in journalism, Ritika Sharma has worked with many reputed media firms focusing on general news such as politics and crime. She joined The Coin Republic as a reporter for crypto, and found a great passion for cryptocurrency, Web3, NFTs and other digital assets. She spends a lot of time researching and delving deeper into these concepts around the clock, and is a strong advocate for women in STEM.


