
 Home
Home News
News

- The Tezos coin has been on a downward trend after slipping through the rising parallel channel.
- In the context of the daily price chart, the RSI broke below the halfway mark (50 points) on March 5.
- Tezos coin belonging to the bitcoin pair is trading down 2% at 0.00007331 Satoshis.
The Tezos token has resumed a negative trend, shedding 22% of its value last week; nevertheless, XTZ is in a consolidation phase (in the longer time frame) in a larger horizontal range, with a $2.5 million mark in 2022. It indicates that the lower level is significant. Since the beginning of January, the $4.5 level has operated as a strong barrier.

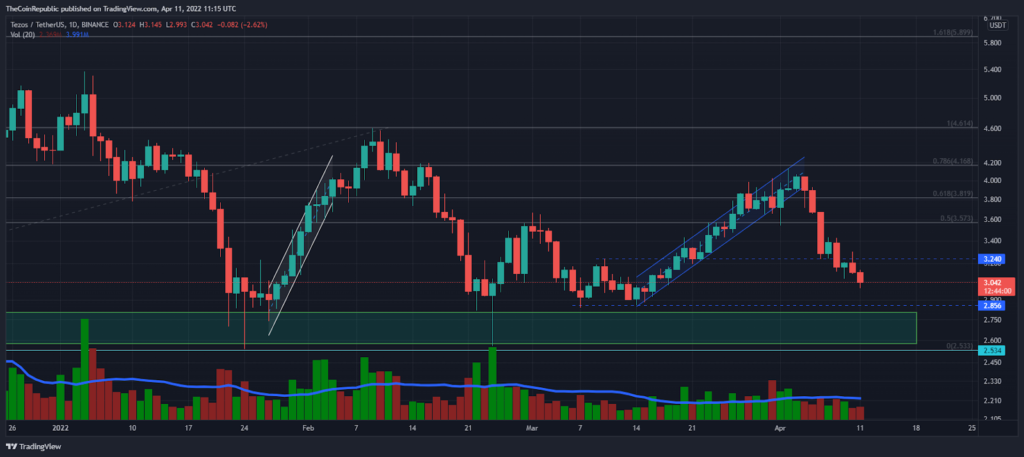
Although the XTZ token recently displayed price action in an ascending parallel channel (blue), sellers interrupted it on April 4. Since the April highs, XTZ has so far lost around 27% of its cost. Thus, at the time of writing XTZ has seen a decline of 5% over the past 24 hours along with the $3.05 mark, according to CMC. Moreover, the XTZ belonging to the bitcoin pair is trading down 2% at 0.00007331 Satoshis.

Daily trading volume reflects low liquidations in the XTZ coin. Despite the facts, traders saw a 41% increase in their trading volume compared to the previous night.
Here are some hidden hints of technical indicators
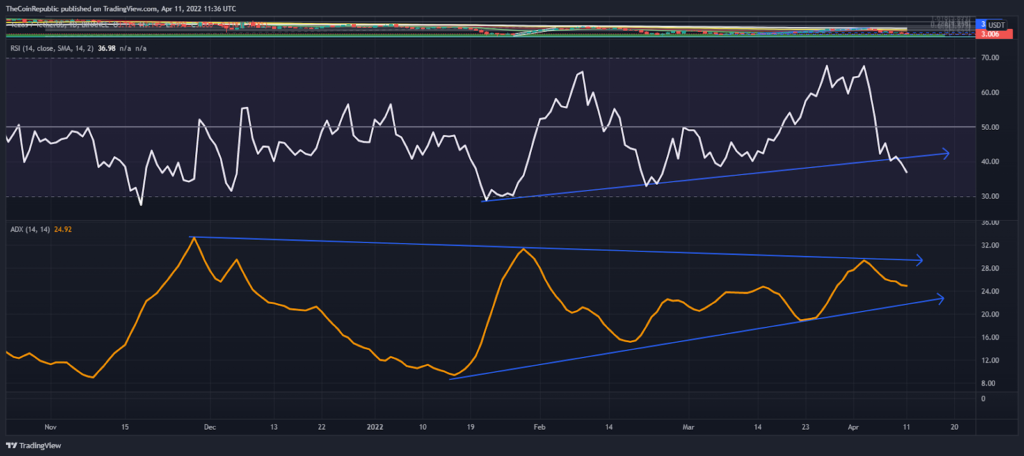
The RSI broke the upward trendline (blue) that was valid over the past 2 months. However, the RSI was rejected below the 70 mark by showing a double top formation in the context of the daily price chart. Now the RSI is at the 37 mark and is moving into the highly oversold area.
The Average Directional Index (ADX) is consolidating in a bearish sign pattern (blue) in the context of the daily price chart. At that time, the ADX was present at 25, suggesting a liquidation decline in the Tezos coin.
Conclusion
The $3.0 appears to be a crucial psychological phase for the Tezos coin. If the bulls fail to manage this trend change zone, the asset could reach below the demand zone (green).
Support level- $2.8 and $2.5
Resistance level – $3.5 and $4.0
Disclaimer
The views and opinions stated by the author, or any people named in this article, are for informational ideas only, and they do not establish the financial, investment, or other advice. Investing in or trading crypto assets comes with a risk of financial loss.
ALSO READ: Will Bitcoin Take Over As A Global Reserve Currency To Replace USD: Anthony Pompliano

Nancy J. Allen is a crypto enthusiast, with a major in macroeconomics and minor in business statistics. She believes that cryptocurrencies inspire people to be their own banks, and step aside from traditional monetary exchange systems. She is also intrigued by blockchain technology and its functioning. She frequently researches, and posts content on the top altcoins, their theoretical working principles and technical price predictions.


