
 Home
Home News
News

- ZRX token price is in a strong uptrend on the daily time frame, and currently, it is trading at $1.0610.
- The token is a forming falling wedge bullish chart pattern on a daily time frame.
- The pair of ZRX/BTC is trading at 0.00002345 with an increase of 45 % in the market cap of the digital asset over the past 24 hours.
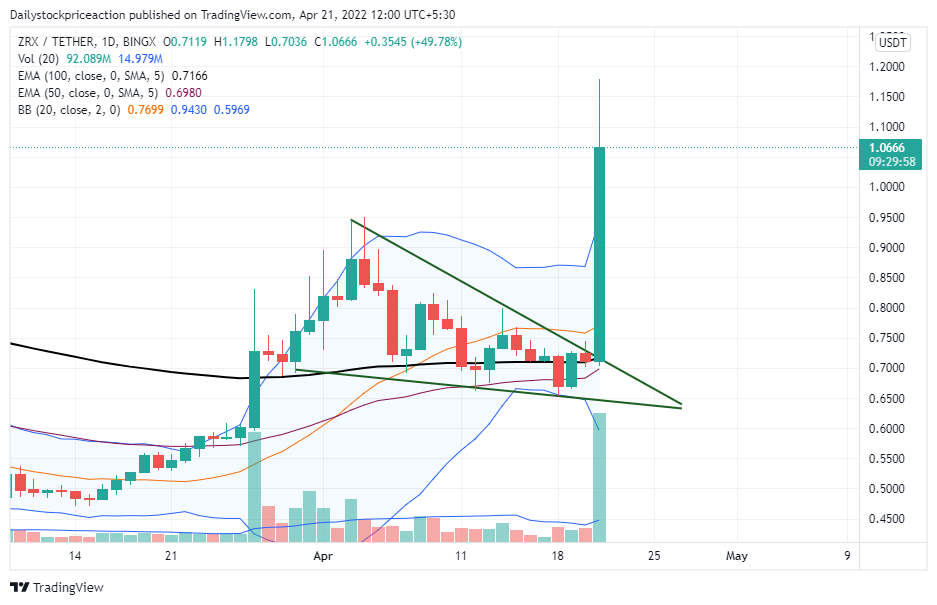
ZRX token price is in an uptrend daily and it has also broken out of the long-term supply zone.ZRX token price is trading above the Supply zone of $0.88 on a daily time frame. The token forms higher low and higher high formation on a daily time frame. At present, the token is resting at a long-term demand zone on the weekly time frame, and thus it can bounce off the demand zone if the bulls support,and as a result the token can be seen moving upside. But if the token breaks the demand zone, it can fall rapidly. Currently, the token is trading above all the crucial Exponential Moving Average (20, 50, 100) and could take support moving forward.ZRX token price has been trading in a small range from past trading weeks, and thus breakout on either side will trigger the big move. The token is currently trading at the upper band of the Bollinger band indicator. The Bollinger band’s range has become narrow, indicating an impulsive move in the upcoming trading days. Volumes have decreased, and thus momentum on any side will continue for a long time due to less volatility.

ZRX token price is forming falling wedge pattern on daily time Frame
ZRX token price was falling from the past trading days, forming lower lows. But recently, the token managed to stay above the previous low despite the selling pressure of the supply zone. As a result, it started trading in a smaller range which led to a breakout of the falling wedge pattern on a daily time frame.

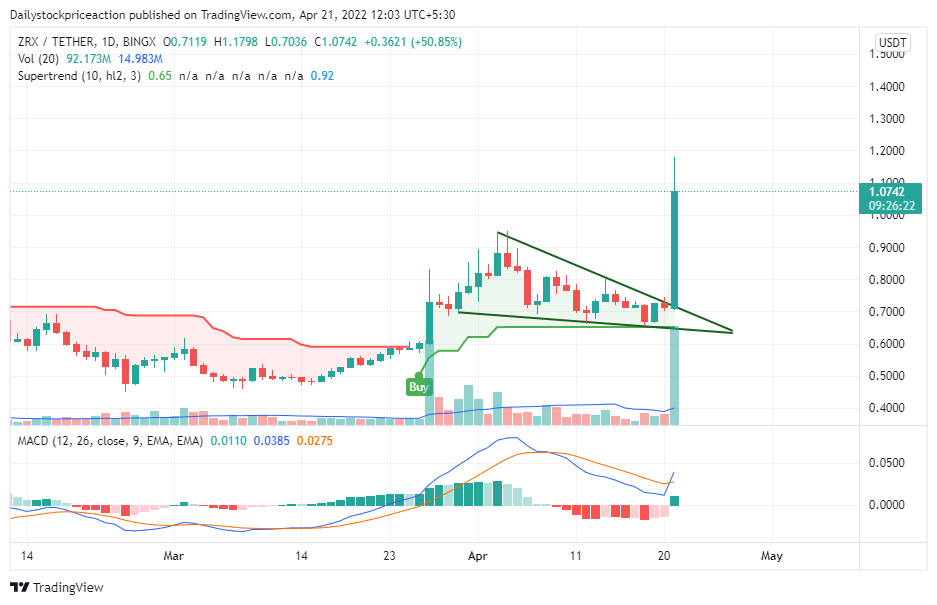
Moving Average Convergence Divergence (Bullish): MACD indicates a bullish trend on the daily time frame as it gave a positive crossover. The buyer’s (blue) signal line crossed the seller’s (orange) upside. If the token breaks out of the green trendline, it can reach $1.16 and above. It is possibly making new highs if the momentum continues.
Supertrend: Recent bullishness in the cryptocurrency market has affected the super trend indicator. The buy signal from the indicator is intact as it broke the supertrend sell line with a strong bullish candlestick pattern. If the token price breaks out of the green supertrend indicator line, the indicator can be seen giving a sell signal. Until then, an investor should remain cautious.
RSI and ADX are showing bullish signs on the daily time frame
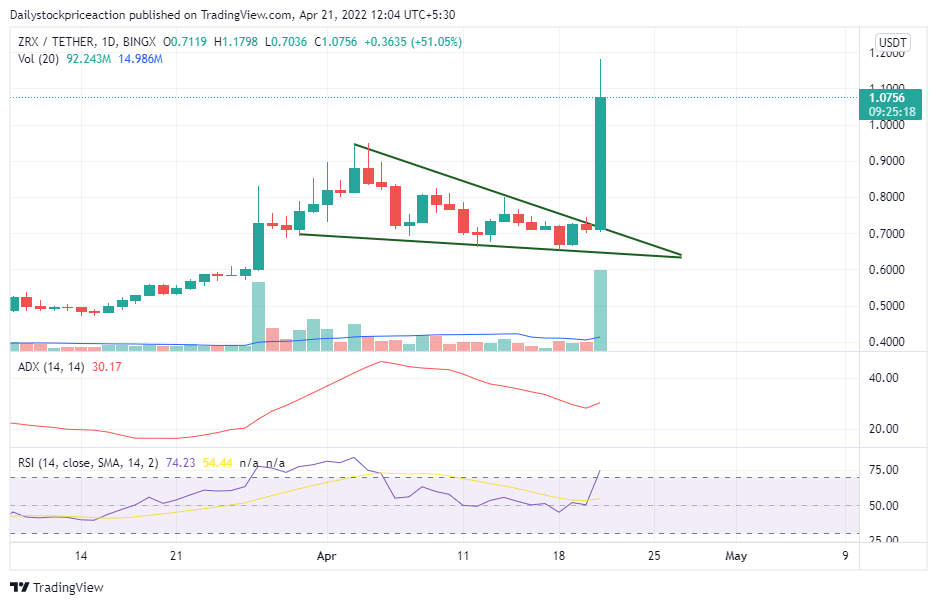
ZRX token price is in an uptrend on a larger time frame, and recently it formed a chart pattern. Once the token breaks out of the pattern, it could trigger a massive move on the breakout side.
Average Directional Movement Index: ADX has been continuously rising from the past trading days, and recently, it went above 30, as the token bounced off the demand zone of $0.733. The ADX curve is seen halting, and it has turned sideways at present. Thus indicating a halt in the movement of the price and possible change in the structure of the price movement.
Relative Strength Indicator: RSI is trading at 7473 as the token forms a bullish reversal pattern. The RSI curve has crossed the 50 halfway mark, and thus, the token can be seen moving up, as it gave a breakout of the falling channel pattern. The RSI curve has also gone past the 20 SMA, indicating a bullish momentum for the upcoming trading days.
Conclusion
As per the price action, ZRX token price is forming a falling wedge bullish chart pattern. The technical parameters are also suggesting bullish momentum for the upcoming trading days. The investor should be cautious until the token breaks out on either side. It remains to see if the token breaks on the upside or bears trample the price down.
SUPPORT: $0.88 and $0.7623
RESISTANCE: $1.172 and $1.205
Disclaimer
The views and opinions stated by the author, or any people named in this article, are for informational ideas only, and they do not establish the financial, investment, or other advice. Investing in or trading crypto assets comes with a risk of financial loss.
ALSO READ: How did the DeFi protocol based on Near Bastion launch BSTN at a $180 mn valuation?

Nancy J. Allen is a crypto enthusiast, with a major in macroeconomics and minor in business statistics. She believes that cryptocurrencies inspire people to be their own banks, and step aside from traditional monetary exchange systems. She is also intrigued by blockchain technology and its functioning. She frequently researches, and posts content on the top altcoins, their theoretical working principles and technical price predictions.


