
 Home
Home News
News

•GRT/USD is currently priced at $0.15 and has increased by 0.50% over the last day

•The technical indicators are showing bearish tendencies in the near term

•The trading volumes have increased by a mammoth 124.31% over the past day
Short Term View: The Graph assumes the bearish stance
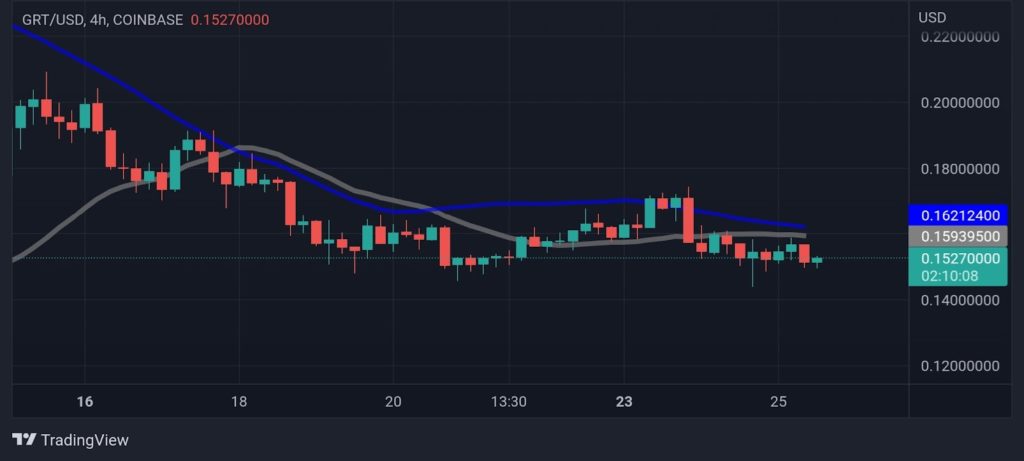
The Graph price today is $0.152485 USD with a 24-hour trading volume of $85,173,134 USD. The Graph is up 0.50% in the last 24 hours. The trading volumes have decreased slightly over the past day whereas the Volume to Market Cap Ratio stands at 0.08095 for the altcoin.
The Graph Coin price in the past week has followed a decent upward trajectory which was successful in halting the downtrend, yet towards the end of the week, the price is again declining as a result of choppy price action. The four-hour chart is trending in a downward channel formation as the Graph Coin price is transacting below the 20,50 SMA on the four hour chart. The recent bearish rising wedge seen on the chart further reiterates the selling pressure as the bears look to have capitalized on the broader market sentiment. The bulls will be looking to defend the support level that is residing at $0.13. The resistance,on the other hand, stands at $0.24 in the event of the bulls making a comeback.
Long Term View for The Graph
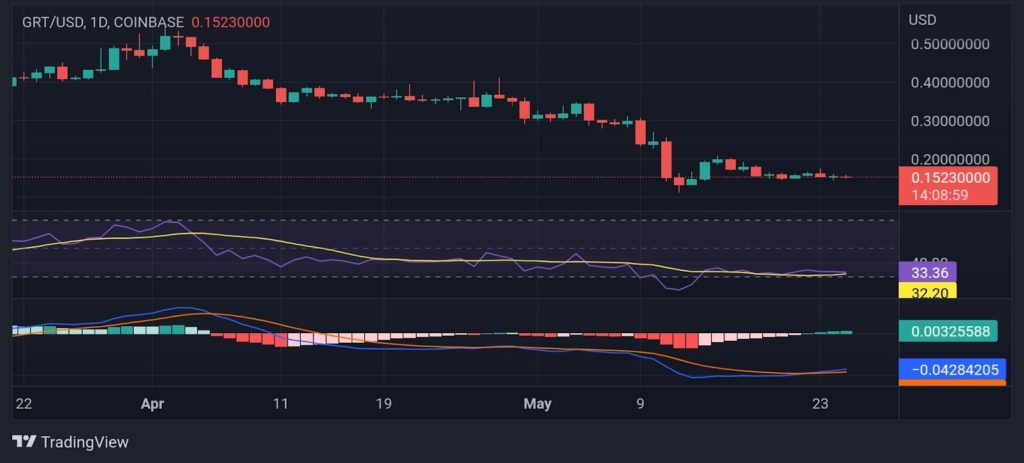
The Graph Coin is currently transacting at a stone’s throw away from the oversold levels, standing at 33.26. The histograms are green but are stagnant at the current price levels, with the altcoin struggling to attract buyers at the aforementioned levels. The MACD and signal lines are reflecting the sideways trend as well. The Graph is trading significantly below it’s all-time high of $2.88 which it clocked on Feb 12, 2021.
Conclusion
The primary trend for The Graph Coin is down and the sellers could come in on the first test of the support level. Overcoming it, however, could lead to a surge further above, thus completing the retracement.
Support: $0.13-$0.10
Resistance: $0.18-$0.24
Disclaimer
The views and opinions stated by the author, or any people named in this article, are for informational ideas only, and they do not establish the financial, investment, or other advice. Investing in or trading crypto assets comes with a risk of financial loss.
ALSO READ: What Will Happen To $26 Billion Staked In Ethereum 2.0 After Merge?

With a background in journalism, Ritika Sharma has worked with many reputed media firms focusing on general news such as politics and crime. She joined The Coin Republic as a reporter for crypto, and found a great passion for cryptocurrency, Web3, NFTs and other digital assets. She spends a lot of time researching and delving deeper into these concepts around the clock, and is a strong advocate for women in STEM.


