
 Home
Home News
News

- Fantom price is falling through a descending parallel channel over the daily chart.
- The crypto asset is trading at 20 SMA and is trying to move towards 50, 100, and 200-days Daily Moving averages.
- The pair of FTM/BTC is at 0.00001275 BTC with an intraday drop of 5.08%.
The Fantom price is trading within a downward parallel channel on the daily chart. Since January 2022, the token has been stuck inside a descending parallel channel. FTM investors are hoping for a recovery in the token’s price daily. FTM coin has to generate sufficient rising momentum to break out of the channel’s consolidation phase. FTM bulls must move forward to carry out the token’s escape strategy and successfully regain FTM’s uptrend momentum.

Fantom price is presently CMP at $0.409 and has lost 0.42% of its market capitalization in the last 24-hour period. In contrast, trading volume has increased by 29.97% in the intraday trading session. This shows that FTM bulls are trying to gather for the token’s rescue. Volume to market cap ratio is 0.3329.

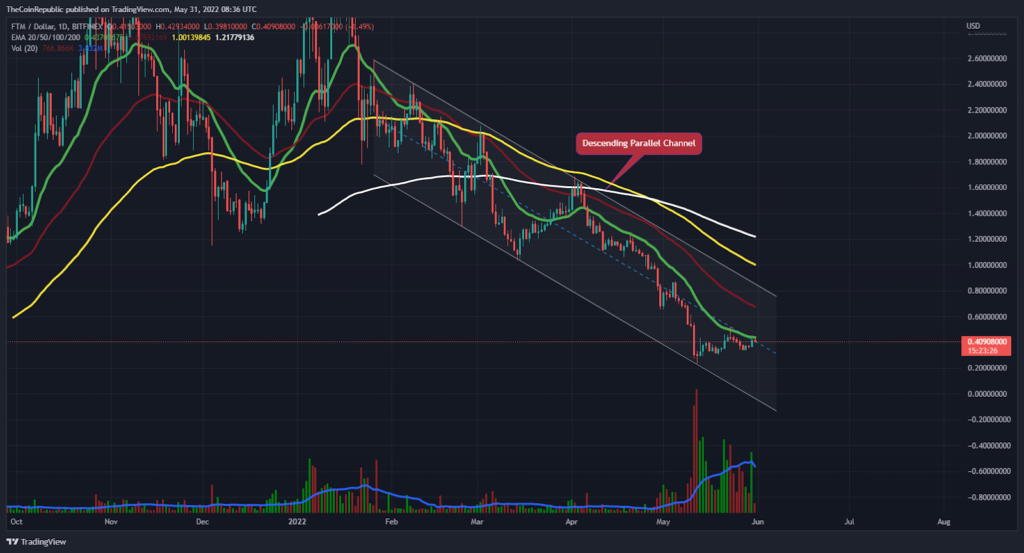
On the daily chart, the price of the FTM token has been trading inside a declining parallel channel. The token attempts to break free from its consolidation phase, requiring it to move upwards with strong rising momentum. FTM bulls attempted to break out of the pattern several times but could not maintain their position at the parallel channel’s top trendline.
The volume change is below normal, and it must expand dramatically during the intraday trading session. FTM must now attract additional buyers, or in other words, buyers must come forward in order for FTM to break free from the pattern.
Support at the lower end is at $0.30, and resistance at the higher side is at $0.70.
Will Fantom Escape the Falling Pattern?
Over the daily chart, the price of Fantom is falling in a parallel channel. FTM bulls must accumulate and adapt to a strong rising momentum to register the token’s breakthrough.
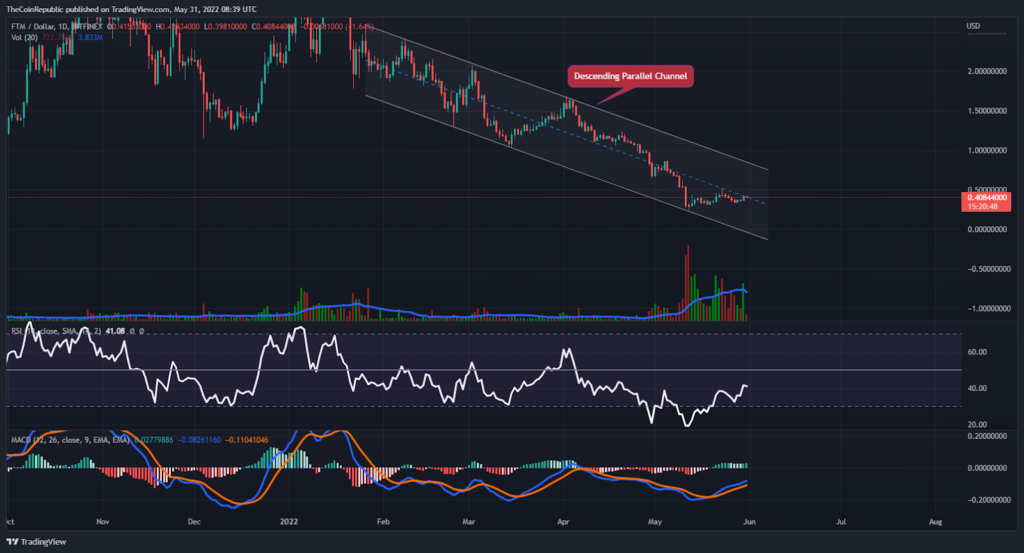
Technical indicators seem pretty divergent at the moment as the price of the crypto asset is moving slightly opposite to the signals of the technical indicators. Relative Strength showcases that FTM token is approaching neutrality. However, MACD exhibits the uptrend momentum of FTM token inside the descending parallel channel. However, FTM is trading towards the upper trendline, and bulls need to sustain to register the token’s breakout. FTM investors need to wait for any directional change as FTM bears may interrupt the momentum and try for a pullback.
Conclusion
On the daily chart, the Fantom price is trading within a downward parallel channel. Since January 2022, the token has been stuck inside a descending parallel channel. FTM investors are hoping for a recovery in the token’s price on a daily basis. FTM bulls must accumulate themselves and adapt to a strong rising momentum. FTM investors need to wait for any directional change as FTM bears may interrupt the momentum and try for a pullback.
Technical Levels
Support Levels: $0.30
Resistance Levels: $0.70
Disclaimer
The views and opinions stated by the author, or any people named in this article, are for informational ideas only, and they do not establish the financial, investment, or other advice. Investing in or trading crypto assets comes with a risk of financial loss.

Nancy J. Allen is a crypto enthusiast, with a major in macroeconomics and minor in business statistics. She believes that cryptocurrencies inspire people to be their own banks, and step aside from traditional monetary exchange systems. She is also intrigued by blockchain technology and its functioning. She frequently researches, and posts content on the top altcoins, their theoretical working principles and technical price predictions.


