
 Home
Home News
News

- The SHIB price made a breakdown amid the bearish pressure on the market. The bulls need support in order to overcome this dominance.
- The crypto asset is trading below the 20, 50, 100, and 200 daily moving average.
- The SHIB/BTC pair is at 0.000000000339 BTC with a loss of 3.82% in it.
Like many other cryptocurrencies, Shib Inu operates on a decentralized computer network this blockchain database tracks and manages the crypto coin, verifying transactions and recording every transaction that occurs with it. Shiba Inu coin was created anonymously in August 2020 under the pseudonym “Ryoshi.”

The SHIB price after trading in a sideways channel for some time now made a breakdown amid the bearish pressure over the daily graph. Analysts believe that after breaking this support of 0.0000099 USD it will be very difficult for the bulls to make the coin recover. The selling volume is increasing making the price fall. The SHIB price fell 12.9% in 4 days and will fall continuously if the bulls don’t come for help. The price is moving below the exponential moving average of 5 days.

The current price for one SHIB coin is trading at $0.0000097 with a loss of 6.95% in its market capitalization in the last 24 hrs. The coin has a trading volume of 254 million which has gained 28.11% in the 24 hrs trading session and a market cap of 5.3 billion. The volume market cap ratio is 0.0443.
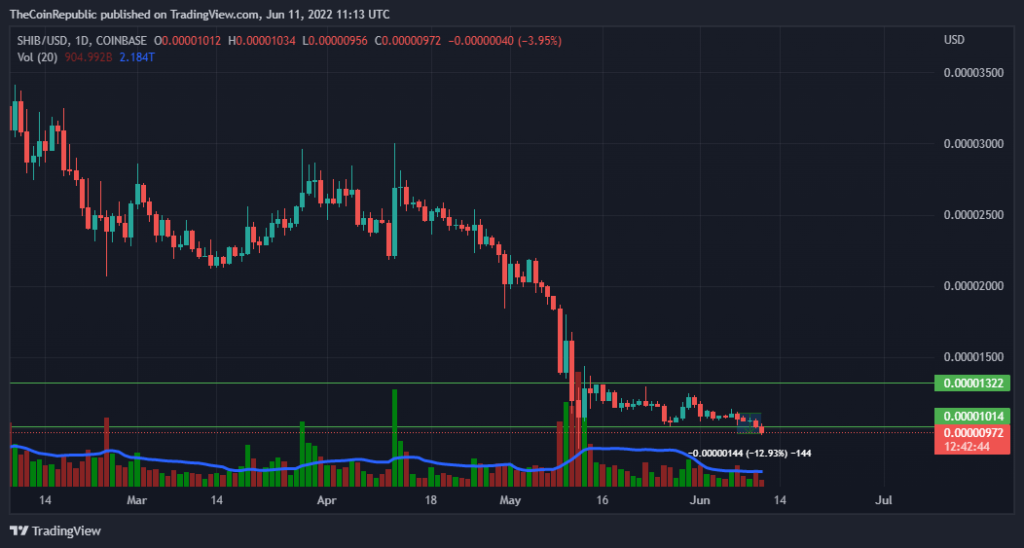
Source: SHIB/USD by Tradingview.
What do Technical Indicators Suggest for SHIB?
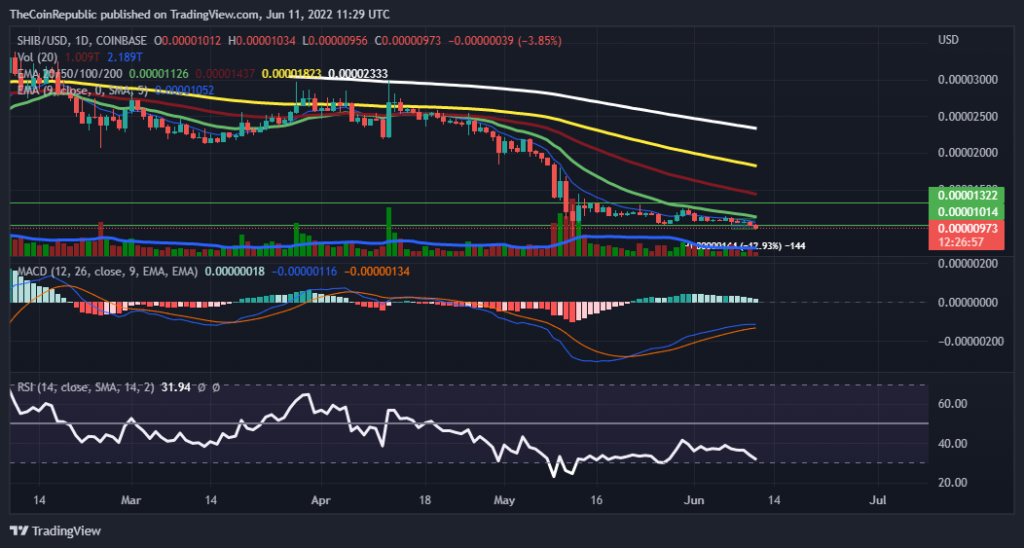
The SHIB price is trading considerably low below the exponential moving average. The technical indicators are indicating a bearish run further.
The MACD indicator can witness a negative cross anytime over the daily graph, as the histograms are getting shorter with time and the MACD line is taking a curve to make a cut over the MACD signal line.
Whereas the relative strength index in support of the above statement can go oversold anytime as the value is below 35 and is still moving downward. The volume is also moving below average.
Conclusion
The SHIB price after trading in a sideways channel for some time now made a breakdown amid the bearish pressure over the daily and hourly graph. The selling volume is increasing making the price fall. The SHIB price fell 12.9% in 4 days. The technical indicators are indicating a bearish run further. The meme coin needs to attract buyers to sustain itself in the market.
Technical levels
Resistance levels: $0.000010 and 0.000015
Support levels: $0.00000925 and $0.00000875
Disclaimer
The views and opinions stated by the author, or any people named in this article, are for informational ideas only, and they do not establish the financial, investment, or other advice. Investing in or trading crypto assets comes with a risk of financial loss.
ALSO READ: LRC Price Analysis: Loopring unsteady amid turbulent times

With a background in journalism, Ritika Sharma has worked with many reputed media firms focusing on general news such as politics and crime. She joined The Coin Republic as a reporter for crypto, and found a great passion for cryptocurrency, Web3, NFTs and other digital assets. She spends a lot of time researching and delving deeper into these concepts around the clock, and is a strong advocate for women in STEM.


