
 Home
Home News
News

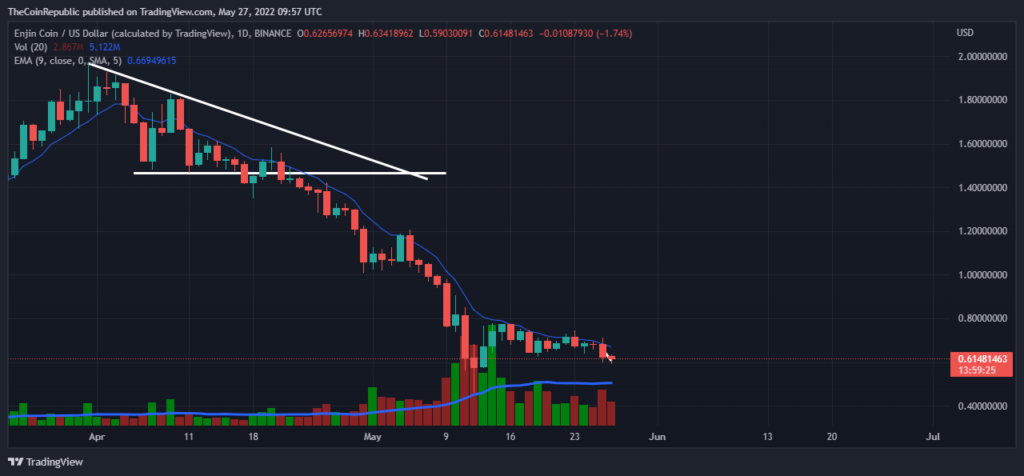
- The ENJ price has been facing a downtrend since the end of March.
- The price is moving below the 20, 50, 100, and 200 daily moving average.
- The ENJ/BTC pair is at 0.00002098 BTC with a loss of 4.10%.
Enjin coin is a project of Enjin, a company that provides an ecosystem of interconnected, blockchain-based gaming products. The coin is unique in that every token minted with the Enjin platform, is directly backed by ENJ, giving in-game items real-world liquidity.

The ENJ price has been facing a continuous downtrend since the end of March. After March it entered a descending triangle which it broke and is still falling. The price made a higher high of $0.65 in the last 24 hrs. The whole crypto market is facing a hard time amid the bearish pressure. It looks like the bulls are not ready to take responsibility, as this could be a great time to enter the market and buy the dip, the prices are considerably low. After falling below the mark of $1 it will be very difficult for the coin to recover.

ENJ is currently at a price of $0.60 with a loss of 4.51% acc. to CMP in its market capitalization in the last 24 hrs. Whereas the 113 million trading volume is at a gain of 4.19% in its selling as the price is still moving low and the market cap of 542 million with a loss of 4.51% in it over the 24 hrs trading session.
What do Technical Indicators Suggest?
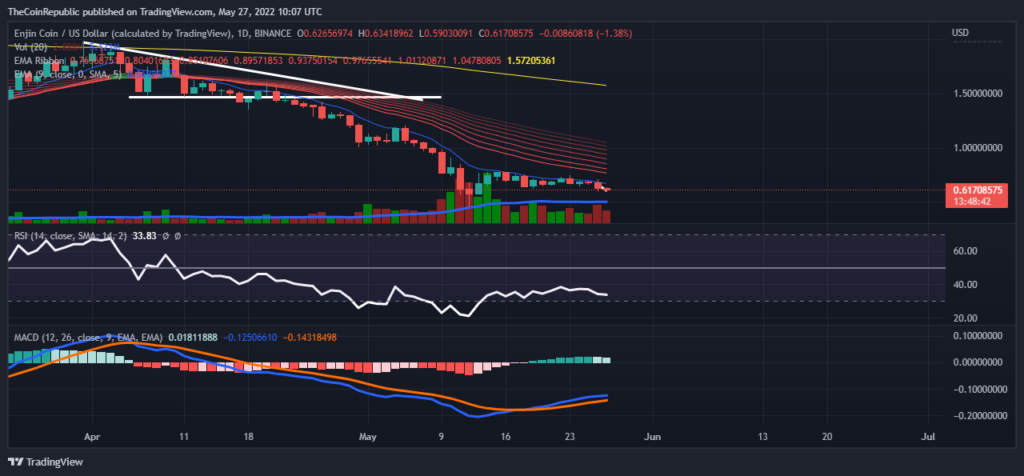
The indicators are quite manipulative this time as while observing the MACD, it indicates a bullish movement as the MACD line is above the MACD signal line and the green histograms are rising.
While the relative strength index line is bending over the oversold region indicating an increase in selling volume. The RSI value for ENJ is below 35 currently. The price is moving below the moving average.
Short Term Analysis
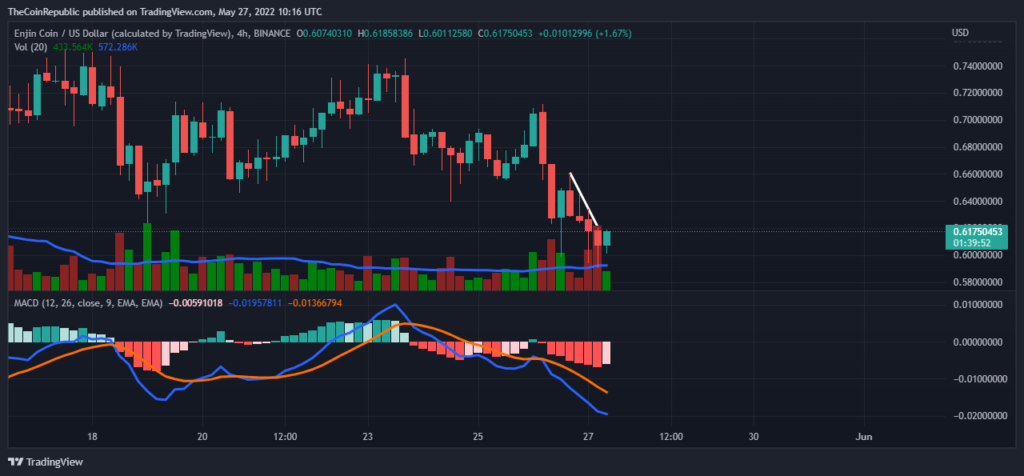
The short-term (4 hrs) analysis also shows the same downtrend in the price. While the MACD is indicating the bearish movement further, the last candle over the 4 hrs graph is making a green move and confusing investors to make a move. Maybe this is the reason the bulls are now taking a step to come forward.
Conclusion
The ENJ price has been facing a continuous downtrend across daily and 4 hrs time frames. Trading volume is at a gain of 4.19%. The indicators are quite manipulative this time. Hence this may be the reason that the investors are not making a move.
Technical levels
Resistance level: $0.70 and $0.80
Support level: $0.50 and $0.40
Disclaimer
The views and opinions stated by the author, or any people named in this article, are for informational ideas only, and they do not establish the financial, investment, or other advice. Investing in or trading crypto assets comes with a risk of financial loss.
ALSO READ: Coinbase Executive Reveals More Job Cuts Can Happen In Future

Nancy J. Allen is a crypto enthusiast, with a major in macroeconomics and minor in business statistics. She believes that cryptocurrencies inspire people to be their own banks, and step aside from traditional monetary exchange systems. She is also intrigued by blockchain technology and its functioning. She frequently researches, and posts content on the top altcoins, their theoretical working principles and technical price predictions.


