
 Home
Home News
News
- Waves price is consolidating after going through a correction phase over the daily price chart.
- The crypto asset is trading below 20, 50, 100 and 200-days Daily Moving Average.
- The pair of WAVES/BTC is at 0.0002326 BTC with an intraday drop of 1.31%.
Waves price is trying to recover from lower levels after coming from a V Top pattern over the daily price chart. V Top pattern is crafted when the price action at first starts surging upwards and then after reaching upto respectable resistance level the token then makes a trend reversal candle suggesting the beginning of the bearish momentum. WAVES price at first started gaining from February 2022 and then in March end the token made a trend reversal candle signifying the bearish momentum of WAVES coin price. Waves then fell with strong downtrend momentum resulting in a V Top pattern over the daily price chart.

Waves price is presently CMP at $4.56 and has gained 0.18% of its market capitalization in the last 24-hour period. However, trading volume has decreased by 38% in the intraday trading session. This signifies that WAVES coin is getting surrounded by the bears and is experiencing short selling at the moment. Volume to market cap ratio is 0.5434.

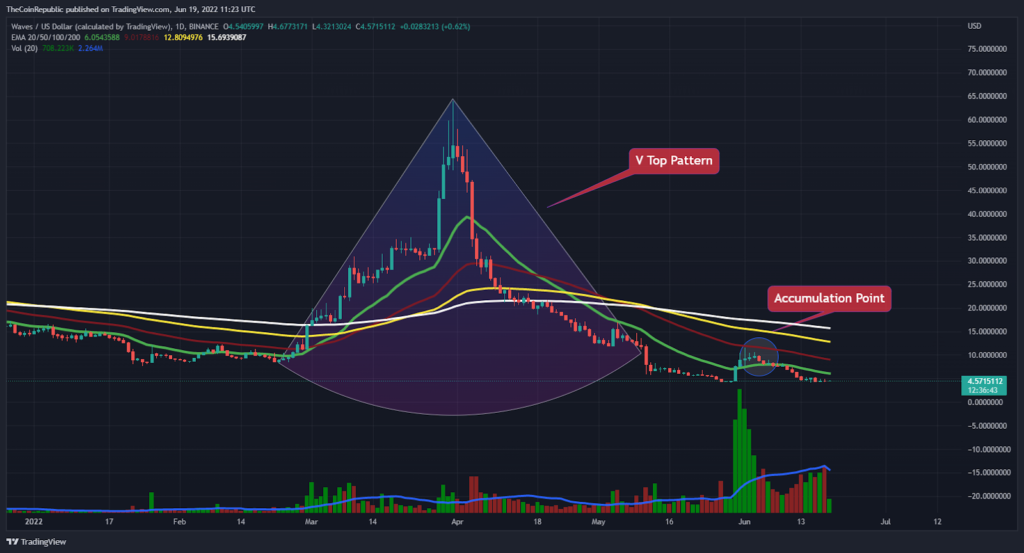
WAVES coin price after falling from a V Top pattern is consolidating for so long and is trying to gain either of the constant momentum. Waves must gather support from buyers in order to escape the consolidation phase over the daily chart. However, volume change can be seen below average and needs to grow for WAVES to avoid turbulence in price. WAVES bulls tried to accumulate themselves to let WAVES coin surge but failed to sustain and the token again went into the consolidation phase.
Horrifying WAVES Creating Turbulence in the Water of Cryptocurrency Market
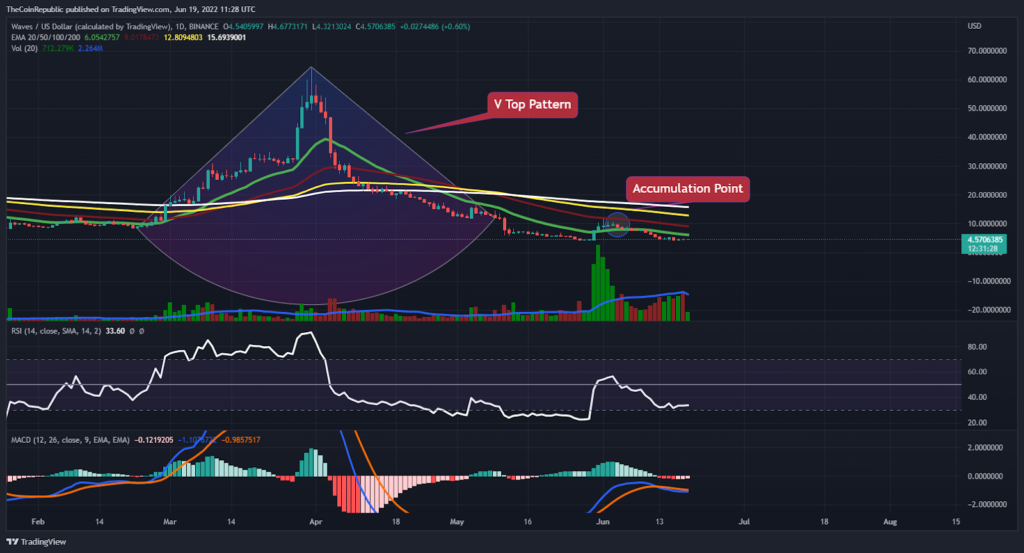
WAVES coin is trying to gain over the daily price chart. However, it falters to attract a significant amount of buyers and results in WAVES sticking inside the consolidation phase. Technical indicators suggest the consolidation phase of WAVES coin price. Relative Strength Index showcases the sideways momentum of WAVES coin. RSI is at 33 and is just above the oversold territory, WAVES investors can expect any directional change as soon as RSI moves towards neutrality or falls deep inside the oversold territory.
MACD exhibits the sideways momentum of the WAVES coin. The MACD line is below the signal line and is heading towards the signal line to register a positive crossover.
Conclusion
Waves price is trying to recover from lower levels after coming from a V Top pattern over the daily price chart. V Top pattern is crafted when the price action at first starts surging upwards and then after reaching upto respectable resistance level the token then makes a trend reversal candle suggesting the beginning of the bearish momentum. volume change can be seen below average and needs to grow for WAVES to avoid turbulence in price. Technical indicators suggest the consolidation phase of WAVES coin price. RSI is at 33 and is just above the oversold territory, WAVES investors can expect any directional change as soon as RSI moves towards neutrality or falls deep inside the oversold territory.
Technical Levels
Support Levels: $4.00 and $3.80
Resistance Levels: $7.80 and $10.00
Disclaimer
The views and opinions stated by the author, or any people named in this article, are for informational ideas only, and they do not establish the financial, investment, or other advice. Investing in or trading crypto assets comes with a risk of financial loss.

Andrew is a blockchain developer who developed his interest in cryptocurrencies while pursuing his post-graduation major in blockchain development. He is a keen observer of details and shares his passion for writing, along with coding. His backend knowledge about blockchain helps him give a unique perspective to his writing skills, and a reliable craft at explaining the concepts such as blockchain programming, languages and token minting. He also frequently shares technical details and performance indicators of ICOs and IDOs.


