
 Home
Home News
News
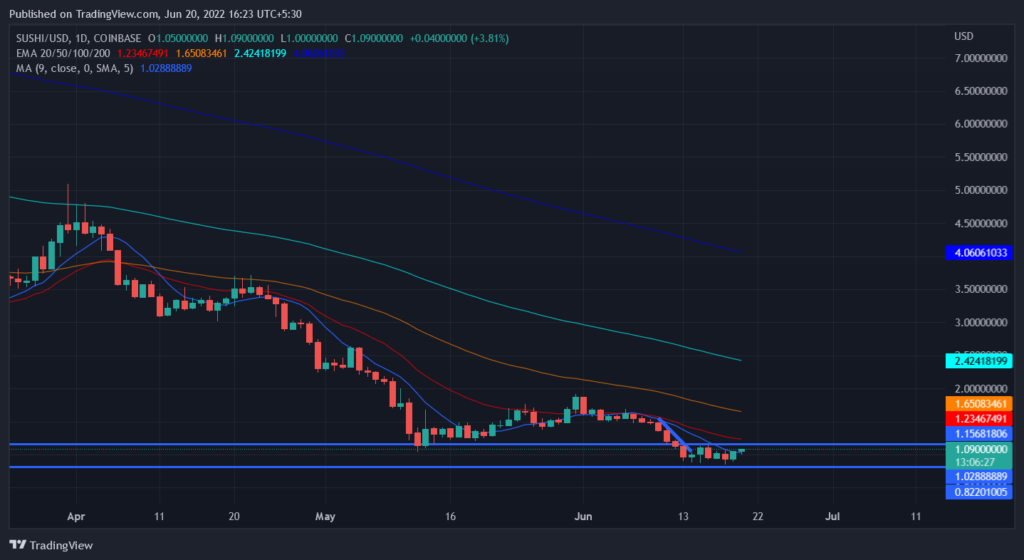
- The bulls has started opposing the bearish influence over the daily graph. The bulls need to be consistent to make the trend reversal successful.
- The crypto asset in moving above the 20, 50, 100 and 200 daily moving average.
- The SUSHI/BTC pair is at 0.00005022 BTC with a gain of 4.27% in it.
SushiSwap (SUSHI) is an example of an automated market maker (AMM). An increasingly popular tool among cryptocurrency users, AMMs are decentralized exchanges which use smart contracts to create markets for any given pair of tokens. SushiSwap primarily exists as an AMM, through which automated trading liquidity is set up between any two cryptocurrency assets.
After the long bearish influence the token has now managed to accumulate the bulls over the daily graph. The bulls need to support the coin constantly to make trend reversal, as the whole crypto market is facing hard times. Amid the bearish pressure the coin fell below the crucial support of $1 which is now being opposed by the SUSHI bulls which needs to be amplified. The crypto asset is currently moving above the 5 day simple moving average. This recovery is not enough for the coin to sustain, hence it needs more buyers and needs to push the volume up.
Current price for one SUSHI token is trading at $1.09 with a gain of 11.74% in it in the last 24 hrs trading session. The token has a trading volume of 90 million with again of 5.70% in the 24 hrs trading session and a market cap of 138 million.
Short-term Analysis for SUSHI
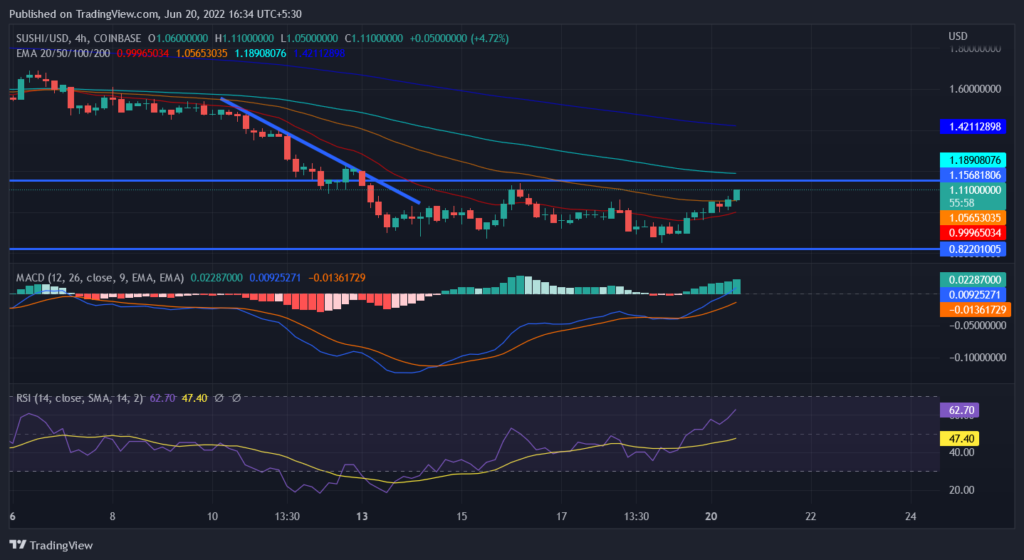
The SUSHI toke has successfully managed to attract the buyers as the trend reversal has begun over the short term (4 hrs) graph. The movement should be constant and the coin still needs volume support as the trading volume is still at a growth of 5.70% only. The coin is moving significantly above the exponential moving average of 5 days. The technical indicators are suggesting a bullish movement further over the hourly graph as the histograms are rising green over the MACD indicator indicating the signal strength. The relative strength index value is above 45.
ALSO READ – Celsius Warns Stabilizing Liquidity ‘Will Take Time’
Conclusion
After the long bearish influence, the token has now managed to accumulate the bulls over the daily graph. The bulls need to support the coin constantly to make trend reversal successful. The crypto asset is currently moving above the 5 day simple moving average. The technical indicators suggest a bullish run further. The investors are finding the dip a good opportunity to enter the market.
Technical levels
Resistance levels: $1.15 and $1.25
Support levels: $0.82 and $0.70
Disclaimer
The views and opinions stated by the author, or any people named in this article, are for informational ideas only, and they do not establish the financial, investment, or other advice. Investing in or trading crypto assets comes with a risk of financial loss.

Nancy J. Allen is a crypto enthusiast, with a major in macroeconomics and minor in business statistics. She believes that cryptocurrencies inspire people to be their own banks, and step aside from traditional monetary exchange systems. She is also intrigued by blockchain technology and its functioning. She frequently researches, and posts content on the top altcoins, their theoretical working principles and technical price predictions.


