
 Home
Home News
News

- Bitcoin SV price is declining with a strong downtrend momentum over the daily price chart.
- BSV crypto has fallen below 20, 50, 100 and 200-days Daily Moving Average.
- The pair of BSV/BTC is at 0.002757 BTC with an intraday drop of 1.29%.
Bitcoin SV price is trying to gather support from the bulls and they should try for a trend reversal. BSV coin has been falling from a week now and has lost 16% of its market cap throughout the week. BSV coin price has been falling with strong downtrend momentum over the daily price chart. However, given the price is currently moving down, bears are currently in control. Investors in BSV must watch the daily chart for any directional changes. In order to exit the consolidation phase and stay out of the grasp of the short sellers, BSV urgently needs to entice new purchasers.

Bitcoin SV is Currently trading at $53 and has gained 1.01% of its market capitalization in the previous day. However, during the intraday trading session, trading volume surged by 15 %. As a result, the rate of accumulation should be accelerated during the intraday trading session. This demonstrates that purchasers are attempting to accumulate at a sluggish rate. The volume to market cap ratio is 0.07984.

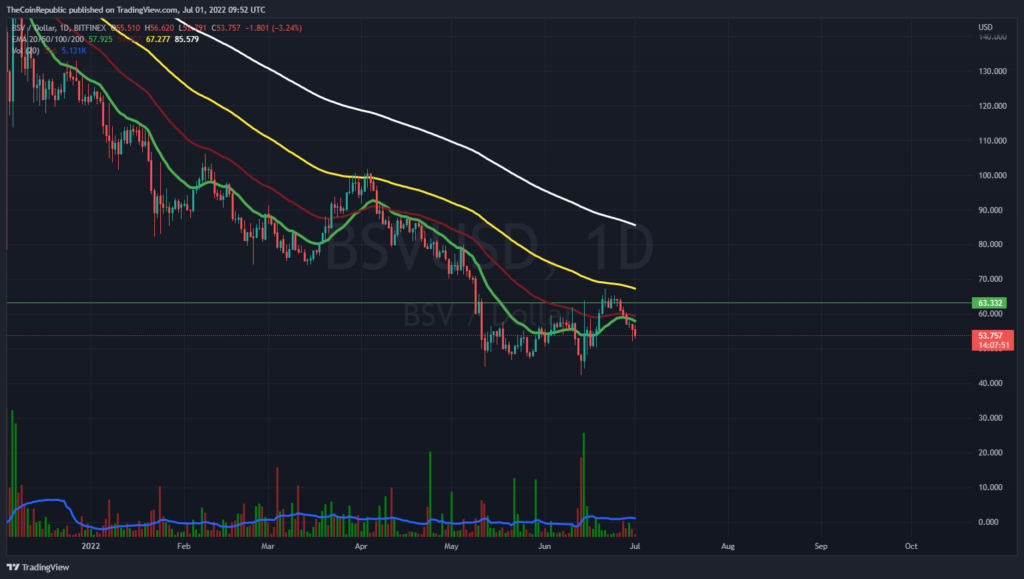
In order to break out of the bearish momentum over the daily chart, BSV coin price needs to draw in more buyers. The token tries to pick up uptrend momentum but struggles to rise higher. However, the volume change is below average and must increase for BSV to correctly register its breakout from the horizontal range-bound area. After preparing for the 20 SMA’s initial bullish obstacle, BSV should aim for the other recovery measures.
Support at the lower end resides at $45, and resistance on the higher side is at $60.
Will BSV Escape the Falling Momentum?
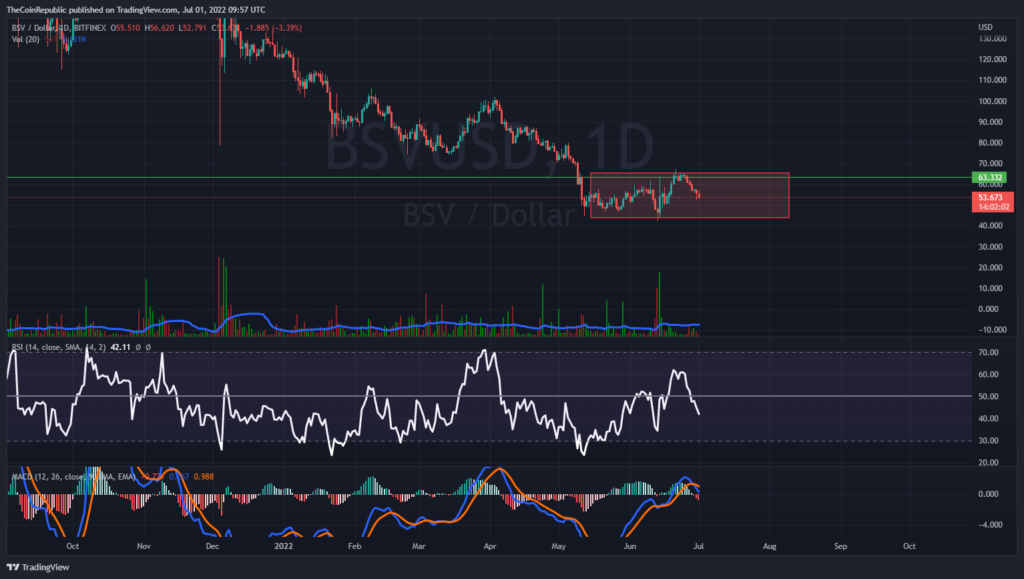
BSV coin price struggles to attract more buyers over the daily price chart. The token must gather support from buyers in order to register its recovery phase. Technical indicators suggest the downtrend momentum of BSV coin and signifies that BSV is trading towards the lower trendline. Relative Strength Index showcases the bearish momentum of BSV coin. RSI is at 42 and is approaching the oversold territory. MACD exhibits the downtrend momentum of BSV coin. The MACD line is below the signal line after a negative crossover.
Conclusion
Bitcoin SV price is trying to gather support from the bulls and they should try for a trend reversal. BSV coin has been falling from a week now and has lost 16% of its market cap throughout the week. BSV coin price has been falling with strong downtrend momentum over the daily price chart. However, given the price is currently moving down, bears are currently in control. However, the volume change is below average and must increase for BSV to correctly register its breakout from the horizontal range-bound area. Technical indicators suggest the downtrend momentum of BSV coin and signifies that BSV is trading towards the lower trendline. RSI is at 42 and is approaching the oversold territory. BSV investors need to wait for any directional change over the daily chart.
Technical Levels
Support Level: $45
Resistance Level: $60
Disclaimer
The views and opinions stated by the author, or any people named in this article, are for informational ideas only, and they do not establish the financial, investment, or other advice. Investing in or trading crypto assets comes with a risk of financial loss.

Nancy J. Allen is a crypto enthusiast, with a major in macroeconomics and minor in business statistics. She believes that cryptocurrencies inspire people to be their own banks, and step aside from traditional monetary exchange systems. She is also intrigued by blockchain technology and its functioning. She frequently researches, and posts content on the top altcoins, their theoretical working principles and technical price predictions.


