
 Home
Home News
News
- Solana price moved into a tight range-bound phase when the bulls crossed this sideways zone.
- The daily RSI indicator is showing a sideways zone with a balance at the 50-mark.
- Trading volume has continued to decline since June 13, reaching just below $1.4 billion last night.
Solana Coin was a highly profitable asset in 2021 as it extended its journey from $1.5 to its 52-week high of $259.9. As the entire cryptocurrency climbed to its top, greed increased, and so did the result, but now everyone prays to see their portfolio go green, which they have built to the top.

Solana coin has halted its downtrend while the bulls are barely managing their costs near the 90-day low near $26.06. Although bears are also active in this range bound market, therefore, the price is trapped in a tight horizontal range between $32 to $39 (gray box). Despite the range-bound phase, the weekly candlestick shows price in green since last week.

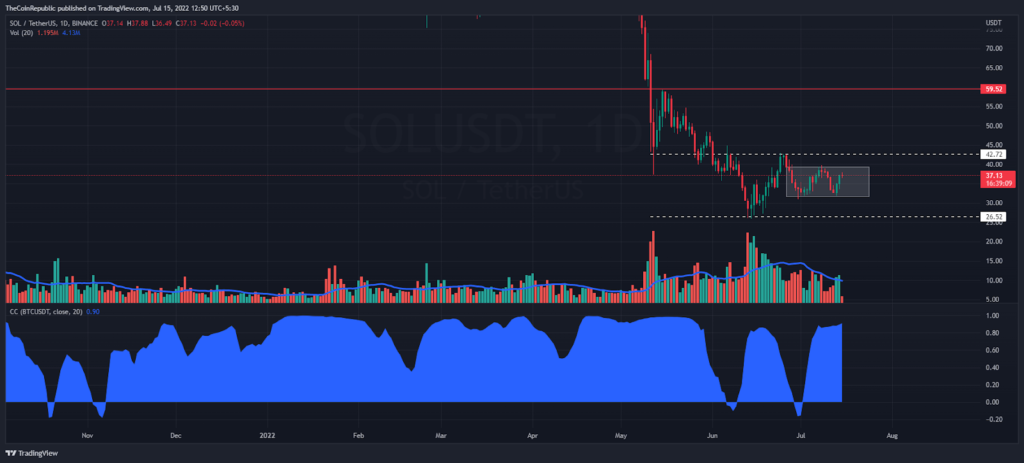
According to the correlation coefficient indicator (above chart) the correlation between the Solana and bitcoin pair is 90 points. This could be one of the reasons behind the range-bound phase of the given altcoin as bitcoin has been hovering around the $20K level over the past few weeks. Thus, the SOL/BTC pair price is up 4.6% at the 0.001788 mark.
Recently, SOL crypto price has reversed from the support level of the given range and is showing bullish momentum. As a result, the market capitalization rose by 8.2% to above $12.8 billion in the last 24 hours. At the time of writing, the altcoin was trading at the $37.2 mark amid bullish momentum. However, trading volume has continued to decline since June 13, reaching just below $1.4 billion last night.
SOL Price is Above the Bears’ Hedge Zone
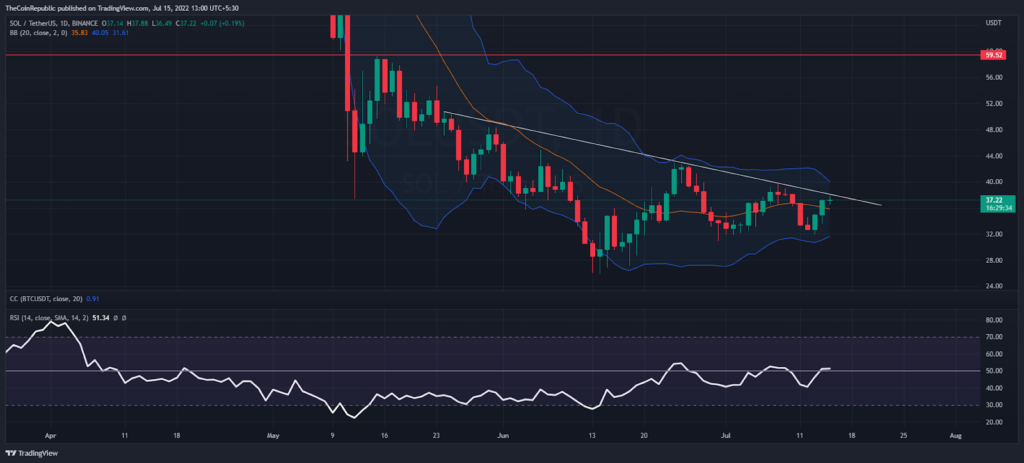
During the uptrend, Solana price is approaching a bearish trend line (white). Nevertheless, the price is above the mid-band (20-day moving average) of the Bollinger Bands indicator during the daily price chart.
Furthermore, the RSI indicator is showing a sideways zone at its peak at the 50-point. But if SOL price breaks this horizontal range then its peak may move towards the overbought zone.
Conclusion
However, solana price is well above the mid-band of the Bollinger Bands indicator, so the bulls may attempt to hit its upper-band soon. But the trading volume shows slightly less volatility, so the bulls need to accumulate more SOL coin.
Support level – $26 and $20
Resistance level – $50 and $100
Disclaimer
The views and opinions stated by the author, or any people named in this article, are for informational ideas only, and they do not establish financial, investment, or other advice. Investing in or trading crypto assets comes with a risk of financial loss.

Andrew is a blockchain developer who developed his interest in cryptocurrencies while pursuing his post-graduation major in blockchain development. He is a keen observer of details and shares his passion for writing, along with coding. His backend knowledge about blockchain helps him give a unique perspective to his writing skills, and a reliable craft at explaining the concepts such as blockchain programming, languages and token minting. He also frequently shares technical details and performance indicators of ICOs and IDOs.


